
Page 25 - Fluid Power Engineering
P. 25
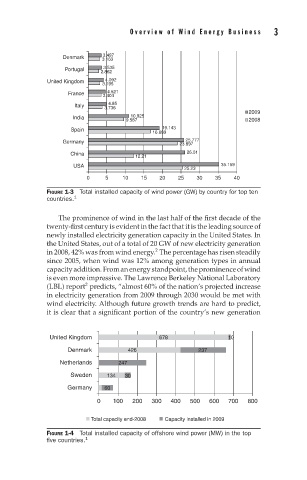
Overview of W ind Energy Business     3


                             3.497
                  Denmark   3.163
                  Portugal   3.535
                            2.862
              United Kingdom  4.092
                            3.195
                   France     4.521
                             3.404
                     Italy    4.85
                             3.736
                                                                    2009
                     India          10.925
                                   9.587                            2008
                    Spain                   19.143
                                          16.689
                  Germany                          25.777
                                                 23.897
                    China            12.21         26.01
                     USA                                    35.159
                                                  25.23
                        0    5    10   15   20   25   30   35   40
              FIGURE 1-3 Total installed capacity of wind power (GW) by country for top ten
              countries. 1

                 The prominence of wind in the last half of the first decade of the
              twenty-first century is evident in the fact that it is the leading source of
              newly installed electricity generation capacity in the United States. In
              the United States, out of a total of 20 GW of new electricity generation
                                           2
              in 2008, 42% was from wind energy. The percentage has risen steadily
              since 2005, when wind was 12% among generation types in annual
              capacityaddition.Fromanenergystandpoint,theprominenceofwind
              is even more impressive. The Lawrence Berkeley National Laboratory
                        2
              (LBL) report predicts, “almost 60% of the nation’s projected increase
              in electricity generation from 2009 through 2030 would be met with
              wind electricity. Although future growth trends are hard to predict,
              it is clear that a significant portion of the country’s new generation


              United Kingdom                678               10
                   Denmark         426                237
                 Netherlands     247
                    Sweden    134  30
                   Germany   60

                           0   100  200   300  400  500  600  700  800

                         Total capacity end-2008  Capacity installed in 2009
              FIGURE 1-4 Total installed capacity of offshore wind power (MW) in the top
              five countries. 1