
Page 214 - Wind Energy Handbook
P. 214
188 WIND-TURBINE PERFORMANCE
chosen to be somewhat higher than the zero power speed, in the present case, say
4m=s.
The cut-out speed is chosen to protect the turbine from high loads, usually about
25 m=s.
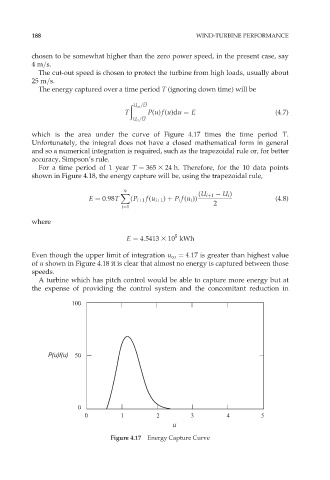
The energy captured over a time period T (ignoring down time) will be
ð
U co =U
T P(u)f(u)du ¼ E (4:7)
U ci =U
which is the area under the curve of Figure 4.17 times the time period T.
Unfortunately, the integral does not have a closed mathematical form in general
and so a numerical integration is required, such as the trapezoidal rule or, for better
accuracy, Simpson’s rule.
For a time period of 1 year T ¼ 365 3 24 h. Therefore, for the 10 data points
shown in Figure 4.18, the energy capture will be, using the trapezoidal rule,
X (U iþ1 U i )
9
E ¼ 0:98T (P iþ1 f(u iþ1 ) þ P i f(u i )) (4:8)
2
i¼1
where
5
E ¼ 4:5413 3 10 kWh
Even though the upper limit of integration u co ¼ 4:17 is greater than highest value
of u shown in Figure 4.18 it is clear that almost no energy is captured between those
speeds.
A turbine which has pitch control would be able to capture more energy but at
the expense of providing the control system and the concomitant reduction in
100
P(u)f(u) 50
0
0 1 2 3 4 5
u
Figure 4.17 Energy Capture Curve