
Page 209 - Wind Energy Handbook
P. 209
COMPARISON OF MEASURED WITH THEORETICAL PERFORMANCE 183
When the turbine was under test the chosen rotational speed was 44 r.p.m.
Energy output and wind speed were measured over 1 min time intervals and the
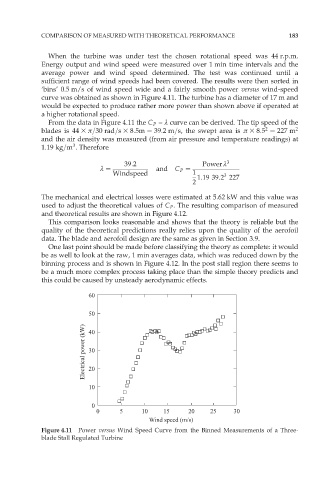
average power and wind speed determined. The test was continued until a
sufficient range of wind speeds had been covered. The results were then sorted in
‘bins’ 0.5 m/s of wind speed wide and a fairly smooth power versus wind-speed
curve was obtained as shown in Figure 4.11. The turbine has a diameter of 17 m and
would be expected to produce rather more power than shown above if operated at
a higher rotational speed.
From the data in Figure 4.11 the C P – º curve can be derived. The tip speed of the
2
blades is 44 3 ð=30 rad=s 3 8:5m ¼ 39:2m=s, the swept area is ð 3 8:5 ¼ 227 m 2
and the air density was measured (from air pressure and temperature readings) at
3
1:19 kg=m . Therefore
39:2 Power º 3
º ¼ and C P ¼
Windspeed 1 3
1:19 39:2 227
2
The mechanical and electrical losses were estimated at 5.62 kW and this value was
used to adjust the theoretical values of C P . The resulting comparison of measured
and theoretical results are shown in Figure 4.12.
This comparison looks reasonable and shows that the theory is reliable but the
quality of the theoretical predictions really relies upon the quality of the aerofoil
data. The blade and aerofoil design are the same as given in Section 3.9.
One last point should be made before classifying the theory as complete: it would
be as well to look at the raw, 1 min averages data, which was reduced down by the
binning process and is shown in Figure 4.12. In the post stall region there seems to
be a much more complex process taking place than the simple theory predicts and
this could be caused by unsteady aerodynamic effects.
60
50
Electrical power (kW) 30
40
20
10
0
0 5 10 15 20 25 30
Wind speed (m/s)
Figure 4.11 Power versus Wind Speed Curve from the Binned Measurements of a Three-
blade Stall Regulated Turbine