
Page 336 - Wind Energy Handbook
P. 336
310 DESIGN LOADS FOR HORIZONTAL-AXIS WIND TURBINES
For three-bladed machines, the five hub-height fatigue loads are almost entirely
stochastic, because the deterministic load component is either constant (for a given
mean wind speed) or negligible, and it is instructive to consider how they relate to
one another. Recognizing that the centre of any gust lying off the rotor centre will be
located at a random azimuth, then it is clear that the rotor out-of-plane loads, i.e., the
moment about the horizontal axis, M Y (H, t), the hub moment about the vertical axis,
M Z (H, t), and the rotor thrust, F X (H, t), will all be statistically independent of each
other. The same will apply to the rotor in-plane loads – the rotor torque, M X (H, t),
and the sideways load, F Y (H, t). However, as the out-of-plane and in-plane loads on
a blade element are both assumed to be proportional to the local wind speed
fluctuation, u, it follows that the rotor torque fluctuations will be in phase with the
rotor thrust fluctuations, and the rotor sideways load fluctuations will be in phase
with the fluctuations of the hub moment about the horizontal axis, M Y (H, t).
The above relationships have implications for the combination of fatigue loads.
Clearly the power spectrum of the fore-aft tower moment at height z, S My (z, n), can
be obtained by simply adding the power spectrum of the hub moment about the
2
horizontal axis to (H z) times the power spectrum of the rotor thrust. Similarly
the power spectrum of the side-to-side tower moment at height z, S Mx (z, n), can be
2
obtained by adding the power spectrum of the rotor torque to (H z) times the
power spectrum of the rotor sideways load.
Having obtained power spectra for the M X , M Y and M Z moments at height z, the
corresponding fatigue load spectra can be derived with reasonable accuracy by
means of the Dirlik method described in Section 5.9.3. As the tower stress ranges
will be enhanced by tower resonance, the input power spectra should incorporate
dynamic magnification, as outlined in Section 5.12.5.
Fatigue stress ranges due to bending about the two axes can easily be calculated
separately from the M X (z) and M Y (z) fatigue spectra, but the stress ranges due to
the two fatigue spectra combined cannot be calculated precisely because of lack of
information about phase relationships. However, as noted above, the M X (H)
component of the M X (z) fluctuations is in phase with the F X (H) component of the
M Y (z) fluctuations, and the F Y (H) component of the M X (z) fluctuations is in phase
with the M Y (H) component of the M Y (z) fluctuations so the stress ranges due to the
M X (z) and M Y (z) fatigue spectra combined can be conservatively calculated as if
they were in phase too. Theoretically this means pairing the largest M X (z) and
M Y (z) loading cycles, the second largest, the third largest and so on, right through
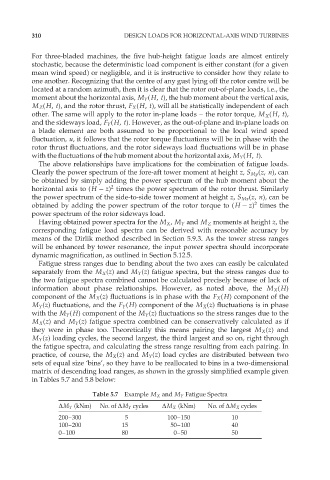
the fatigue spectra, and calculating the stress range resulting from each pairing. In
practice, of course, the M X (z) and M Y (z) load cycles are distributed between two
sets of equal size ‘bins’, so they have to be reallocated to bins in a two-dimensional
matrix of descending load ranges, as shown in the grossly simplified example given
in Tables 5.7 and 5.8 below:
Table 5.7 Example M X and M Y Fatigue Spectra
˜M Y (kNm) No. of ˜M Y cycles ˜M X (kNm) No. of ˜M X cycles
200–300 5 100–150 10
100–200 15 50–100 40
0–100 80 0–50 50