
Page 84 - Characterization and Properties of Petroleum Fractions - M.R. Riazi
P. 84
QC: —/—
P2: —/—
P1: KVU/—
AT029-Manual-v7.cls
AT029-02
AT029-Manual
64 CHARACTERIZATION AND PROPERTIES OF PETROLEUM FRACTIONS
Critical Compersibility Factor T1: IML August 16, 2007 16:6
Carbon Number
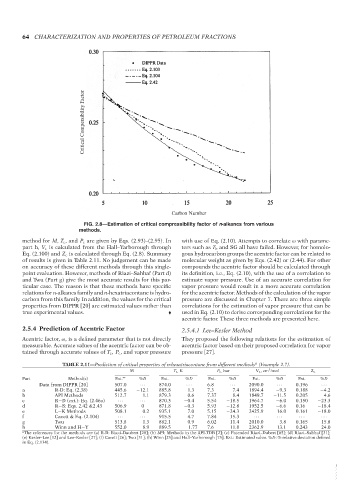
FIG. 2.8—Estimation of critical compressibility factor of n-alkanes from various
methods.
method for M, T c , and P c are given by Eqs. (2.93)–(2.95). In with use of Eq. (2.10). Attempts to correlate ω with parame-
part h, V c is calculated from the Hall–Yarborough through ters such as T b and SG all have failed. However, for homolo-
Eq. (2.100) and Z c is calculated through Eq. (2.8). Summary gous hydrocarbon groups the acentric factor can be related to
of results is given in Table 2.11. No judgement can be made molecular weight as given by Eqs. (2.42) or (2.44). For other
on accuracy of these different methods through this single- compounds the acentric factor should be calculated through
point evaluation. However, methods of Riazi–Sahhaf (Part d) its definition, i.e., Eq. (2.10), with the use of a correlation to
and Twu (Part g) give the most accurate results for this par- estimate vapor pressure. Use of an accurate correlation for
ticular case. The reason is that these methods have specific vapor pressure would result in a more accurate correlation
relations for n-alkanes family and n-hexatriacontane is hydro- for the acentric factor. Methods of the calculation of the vapor
carbon from this family. In addition, the values for the critical pressure are discussed in Chapter 7. There are three simple
properties from DIPPR [20] are estimated values rather than correlations for the estimation of vapor pressure that can be
true experimental values. used in Eq. (2.10) to derive corresponding correlations for the
acentric factor. These three methods are presented here.
2.5.4 Prediction of Acentric Factor 2.5.4.1 Lee–Kesler Method
Acentric factor, ω, is a defined parameter that is not directly They proposed the following relations for the estimation of
measurable. Accurate values of the acentric factor can be ob- acentric factor based on their proposed correlation for vapor
tained through accurate values of T c , P c , and vapor pressure pressure [27].
a
TABLE 2.11—Prediction of critical properties of n-hexatriacontane from different methods (Example 2.7).
3
M T c, K P c, bar V c ,cm /mol Z c
Part Method(s) Est. ∗∗ %D Est. %D Est. %D Est. %D Est. %D
Data from DIPPR [20] 507.0 ··· 874.0 ··· 6.8 ··· 2090.0 ··· 0.196 ···
a R-D: Eq. (2.38) 445.6 −12.1 885.8 1.3 7.3 7.4 1894.4 −9.3 0.188 −4.2
b API Methods 512.7 1.1 879.3 0.6 7.37 8.4 1849.7 −11.5 0.205 4.6
c R−D (ext.): Eq. (2.46a) ··· ··· 870.3 −0.4 5.54 −18.5 1964.7 −6.0 0.150 −23.3
d R−S: Eqs. 2.42 &2.43 506.9 0 871.8 −0.3 5.93 −12.8 1952.5 −6.6 0.16 −18.4
e L−K Methods 508.1 0.2 935.1 7.0 5.15 −24.3 2425.9 16.0 0.161 −18.0
f Cavett & Eq. (2.104) ··· ··· 915.5 4.7 7.84 15.3 ··· ··· ··· ···
g Twu 513.8 1.3 882.1 0.9 6.02 −11.4 2010.0 −3.8 0.165 −15.8
h Winn and H−Y 552.0 8.9 889.5 1.77 7.6 11.8 2362.9 13.1 0.243 24.0
a The references for the methods are (a) R-D: Riazi–Daubert [28]; (b) API: Methods in the API-TDB [2]; (c) Extended Riazi–Dubert [65]; (d) Riazi–Sahhaf [31];
(e) Kesler–Lee [12] and Lee–Kesler [27]; (f) Cavett [26]; Twu [31]; (h) Winn [25] and Hall–Yarborough [75]. Est.: Estimated value. %D: % relative deviation defined
in Eq. (2.134).
--`,```,`,``````,`,````,```,,-`-`,,`,,`,`,,`---
Copyright ASTM International
Provided by IHS Markit under license with ASTM Licensee=International Dealers Demo/2222333001, User=Anggiansah, Erick
No reproduction or networking permitted without license from IHS Not for Resale, 08/26/2021 21:56:35 MDT