
Page 87 - Characterization and Properties of Petroleum Fractions - M.R. Riazi
P. 87
QC: —/—
T1: IML
P1: KVU/—
P2: —/—
August 16, 2007
AT029-Manual-v7.cls
16:6
AT029-02
AT029-Manual
2. CHARACTERIZATION AND PROPERTIES OF PURE HYDROCARBONS 67
TABLE 2.13—Prediction of density (at 20 C) of pure hydrocarbons.
◦
Estimated density, g/cm 3
n-Paraffin T b, K SG d, g/cm 3 Eq. (2.113) %AD Eq. (2.111) %AD 0.995SG %AD
n-C 5 309.2 0.6317 0.6267 0.6271 0.06 0.6266 0.02 0.6285 0.29
n-C 10 447.3 0.7342 0.7303 0.7299 0.05 0.7299 0.05 0.7305 0.03
n-C 15 543.8 0.7717 0.768 0.7677 0.03 0.7678 0.03 0.7678 0.02
n-C 20 616.9 0.7890 0.7871 0.7852 0.24 0.7852 0.24 0.7851 0.26
n-C 25 683.2 0.8048 0.7996 0.8012 0.20 0.8012 0.19 0.8008 0.15
n-C 30 729.3 0.8123 0.8086 0.8088 0.03 0.8087 0.01 0.8082 0.04
n-C 36 770.1 0.8172 0.8146 0.8138 0.09 0.8137 0.12 0.8131 0.18
Overall 0.10 0.10 0.14
where T b is in Kelvin. This equation predicts n with an aver- numbers greater than C 20 . If other parameters are available
age error of about 1% for pure hydrocarbons from C 5 to C 20 . Eqs. (2.40) may be used with constants given in Tables 2.5
More accurate relations are given by Eq. (2.40) and Table 2.5 and 2.9. The API method to estimate I for hydrocarbons with
in terms of various input parameters. The following method M > 300 is similar to Eq. (2.116) with different numerical
developed by Riazi and Daubert [29] and included in the API- constants. Since for heavy fractions the boiling point is usu-
TDB [2] have accuracy of about 0.5% on n in the molecular ally not available, Eq. (2.117) is presented here. Another rela-
weight range of 70–300. tion for estimation of I for heavy hydrocarbons in terms of T b
and SG is given by Eq. (2.46a) with parameters in Table 2.9,
−4
I = 2.34348 × 10 −2 exp 7.029 × 10 T b + 2.468SG
which can be used for heavy hydrocarbons if distillation data
−3
(2.116) − 1.0267 × 10 T b SG T b 0.0572 SG −0.720 is available.
--`,```,`,``````,`,````,```,,-`-`,,`,,`,`,,`---
Once refractive index at 20 C is estimated, the refractive
◦
where T b is in kelvin. For heavier hydrocarbons (>C 20 ) the
following equation derived from Eq. (2.46b) in terms of M index at other temperatures may be predicted from the
and SG can be used. following empirical relation [37].
(2.118) n T = n 20 − 0.0004(T − 293.15)
I = 1.2419 × 10 −2 exp 7.272 × 10 −4 M + 3.3223SG
where n 20 is refractive index at 20 C (293 K) and n T is the
◦
−1.6117
−4
0.006438
(2.117) −8.867 × 10 MSG M SG
refractive index at the temperature T in which T is in kelvin.
Equation (2.117) is generally applicable to hydrocarbons with Although this equation is simple, but it gives sufficient
a molecular weight range of 70–700 with an accuracy of less accuracy for practical applications. A more accurate relation
than 0.5%; however, it is mainly recommended for carbon can be developed by considering the slope of dn T /dT (value
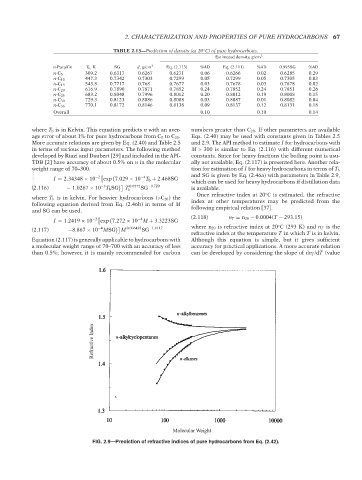
Refractive Index
Molecular Weight
FIG. 2.9—Prediction of refractive indices of pure hydrocarbons from Eq. (2.42).
Copyright ASTM International
Provided by IHS Markit under license with ASTM Licensee=International Dealers Demo/2222333001, User=Anggiansah, Erick
No reproduction or networking permitted without license from IHS Not for Resale, 08/26/2021 21:56:35 MDT