
Page 194 - Mechanical Behavior of Materials
P. 194
Section 5.2 Models for Deformation Behavior 195
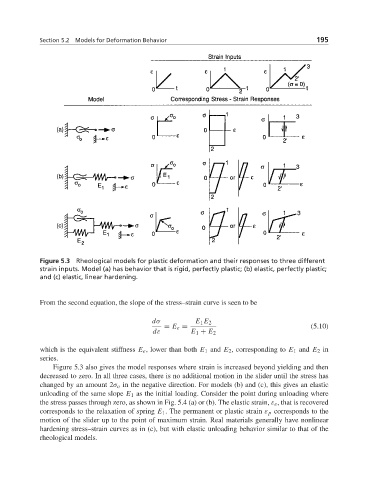
Figure 5.3 Rheological models for plastic deformation and their responses to three different
strain inputs. Model (a) has behavior that is rigid, perfectly plastic; (b) elastic, perfectly plastic;
and (c) elastic, linear hardening.
From the second equation, the slope of the stress–strain curve is seen to be
dσ E 1 E 2
= E e = (5.10)
dε E 1 + E 2
which is the equivalent stiffness E e , lower than both E 1 and E 2 , corresponding to E 1 and E 2 in
series.
Figure 5.3 also gives the model responses where strain is increased beyond yielding and then
decreased to zero. In all three cases, there is no additional motion in the slider until the stress has
changed by an amount 2σ o in the negative direction. For models (b) and (c), this gives an elastic
unloading of the same slope E 1 as the initial loading. Consider the point during unloading where
the stress passes through zero, as shown in Fig. 5.4 (a) or (b). The elastic strain, ε e , that is recovered
corresponds to the relaxation of spring E 1 . The permanent or plastic strain ε p corresponds to the
motion of the slider up to the point of maximum strain. Real materials generally have nonlinear
hardening stress–strain curves as in (c), but with elastic unloading behavior similar to that of the
rheological models.