
Page 329 - Mechanical Behavior of Materials
P. 329
330 Chapter 7 Yielding and Fracture under Combined Stresses
Table P7.42
Test No. σ 3 ,MPa σ 1 = σ 2 ,MPa
1 −225.7 0
2 −548.0 −30.3
Source: Data in [Karfakis 03].
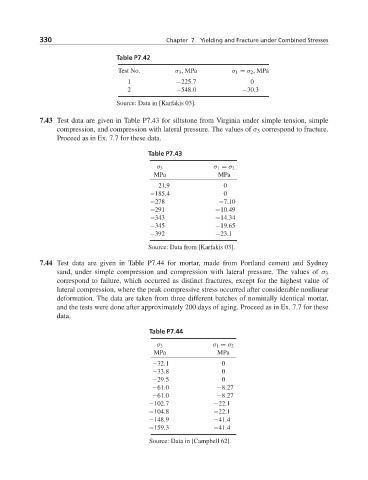
7.43 Test data are given in Table P7.43 for siltstone from Virginia under simple tension, simple
compression, and compression with lateral pressure. The values of σ 3 correspond to fracture.
Proceed as in Ex. 7.7 for these data.
Table P7.43
σ 3 σ 1 = σ 2
MPa MPa
21.9 0
−185.4 0
−278 −7.10
−291 −10.49
−343 −14.34
−345 −19.65
−392 −23.1
Source: Data from [Karfakis 03].
7.44 Test data are given in Table P7.44 for mortar, made from Portland cement and Sydney
sand, under simple compression and compression with lateral pressure. The values of σ 3
correspond to failure, which occurred as distinct fractures, except for the highest value of
lateral compression, where the peak compressive stress occurred after considerable nonlinear
deformation. The data are taken from three different batches of nominally identical mortar,
and the tests were done after approximately 200 days of aging. Proceed as in Ex. 7.7 for these
data.
Table P7.44
σ 3 σ 1 = σ 2
MPa MPa
−32.1 0
−33.8 0
−29.5 0
−61.0 −8.27
−61.0 −8.27
−102.7 −22.1
−104.8 −22.1
−148.9 −41.4
−159.3 −41.4
Source: Data in [Campbell 62].