
Page 330 - Mechanical Behavior of Materials
P. 330
Problems and Questions 331
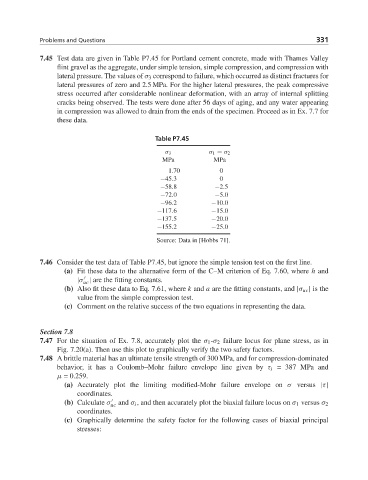
7.45 Test data are given in Table P7.45 for Portland cement concrete, made with Thames Valley
flint gravel as the aggregate, under simple tension, simple compression, and compression with
lateral pressure. The values of σ 3 correspond to failure, which occurred as distinct fractures for
lateral pressures of zero and 2.5 MPa. For the higher lateral pressures, the peak compressive
stress occurred after considerable nonlinear deformation, with an array of internal splitting
cracks being observed. The tests were done after 56 days of aging, and any water appearing
in compression was allowed to drain from the ends of the specimen. Proceed as in Ex. 7.7 for
these data.
Table P7.45
σ 3 σ 1 = σ 2
MPa MPa
1.70 0
−45.3 0
−58.8 −2.5
−72.0 −5.0
−96.2 −10.0
−117.6 −15.0
−137.5 −20.0
−155.2 −25.0
Source: Data in [Hobbs 71].
7.46 Consider the test data of Table P7.45, but ignore the simple tension test on the first line.
(a) Fit these data to the alternative form of the C–M criterion of Eq. 7.60, where h and
|σ | are the fitting constants.
uc
(b) Also fit these data to Eq. 7.61, where k and a are the fitting constants, and |σ uc | is the
value from the simple compression test.
(c) Comment on the relative success of the two equations in representing the data.
Section 7.8
7.47 For the situation of Ex. 7.8, accurately plot the σ 1 -σ 2 failure locus for plane stress, as in
Fig. 7.20(a). Then use this plot to graphically verify the two safety factors.
7.48 A brittle material has an ultimate tensile strength of 300 MPa, and for compression-dominated
behavior, it has a Coulomb–Mohr failure envelope line given by τ i = 387 MPa and
μ = 0.259.
(a) Accurately plot the limiting modified-Mohr failure envelope on σ versus |τ|
coordinates.
(b) Calculate σ uc and σ i , and then accurately plot the biaxial failure locus on σ 1 versus σ 2
coordinates.
(c) Graphically determine the safety factor for the following cases of biaxial principal
stresses: