
Page 208 - Introduction to Statistical Pattern Recognition
P. 208
190 Introduction to Statistical Pattern Recognition
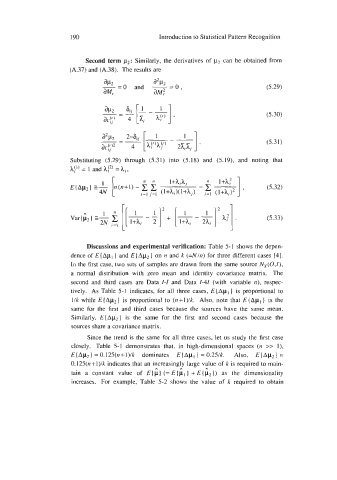
Second term p2: Similarly, the derivatives of p2 can be obtained from
(A.37) and (A.38). The results are
(5.29)
(5.30)
(5.3 1)
Substituting (5.29) through (5.31) into (5.18) and (5.19), and noting that
hi') = 1 and hj2' =hi,
(5.33)
Discussions and experimental verification: Table 5- 1 shows the depen-
dence of E ( Apl } and E ( Ap2 } on n and k (=N ln) for three different cases [4].
In the first case, two sets of samples are drawn from the same source Nx(U,I),
a normal distribution with zero mean and identity covariance matrix. The
second and third cases are Data 1-1 and Data I-41 (with variable n), respec-
tively. As Table 5-1 indicates, for all three cases, E{Apl } is proportional to
llk while E(Ap2) is proportional to (n+l)lk. Also, note that E(Apl ) is the
same for the first and third cases because the sources have the same mean.
Similarly, E{Ap2) is the same for the first and second cases because the
sources share a covariance matrix.
Since the trend is the same for all three cases, let us study the first case
closely. Table 5-1 demonstrates that, in high-dimensional spaces (n >> I),
E(Ap2J = 0.125(n+l)/k dominates E(Ap, } = 0.25lk. Also, E(Ap2) =
0.125(n+l)/k indicates that an increasingly large value of k is required to main-
,.
1
A
tain a constant value of E 1 p 1 (= E { pl ) + E { p2 1) as the dimensionality
increases. For example, Table 5-2 shows the value of k required to obtain