
Page 214 - Introduction to Statistical Pattern Recognition
P. 214
196 Introduction to Statistical Pattern Recognition
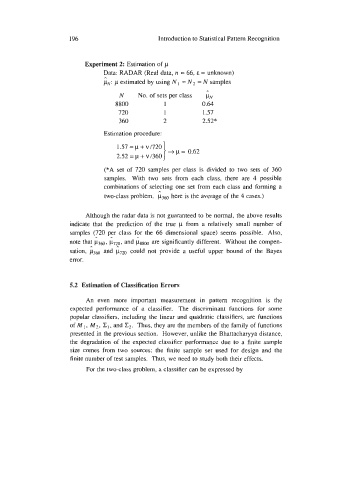
Experiment 2: Estimation of p
Data: RADAR (Real data, n = 66, E = unknown)
n
pN: p estimated by using N = N2 = N samples
I
n
N No. of sets per class pN
8800 1 0.64
720 1 1.57
360 2 2.52*
Estimation procedure:
1.57 =p+v/720 + p = 0.62
2.52 = p + v I360
(*A set of 720 samples per class is divided to two sets of 360
samples. With two sets from each class, there are 4 possible
combinations of selecting one set from each class and forming a
A
two-class problem. p3@ here is the average of the 4 cases.)
Although the radar data is not guaranteed to be normal, the above results
indicate that the prediction of the true p from a relatively small number of
samples (720 per class for the 66 dimensional space) seems possible. Also,
, . A ,.
note that p360, ~720, and p88@) are significantly different. Without the compen-
,. A
sation, p360 and ~720 could not provide a useful upper bound of the Bayes
error.
5.2 Estimation of Classification Errors
An even more important measurement in pattern recognition is the
expected performance of a classifier. The discriminant functions for some
popular classifiers, including the linear and quadratic classifiers, are functions
of MI, M2, XI, and X2. Thus, they are the members of the family of functions
presented in the previous section. However, unlike the Bhattacharyya distance,
the degradation of the expected classifier performance due to a finite sample
size comes from two sources: the finite sample set used for design and the
finite number of test samples. Thus, we need to study both their effects.
For the two-class problem, a classifier can be expressed by