
Page 223 - Introduction to Statistical Pattern Recognition
P. 223
5 Parameter Estimation 205
tion of MI, M,, E,, and &, g(X) becomes lln as is seen in (5.70). The qua-
dratic and linear classifiers of (5.54) and (5.55) belong to this case. Therefore,
for these classifiers.
(5.71)
The v of (5.71) is determined by the underlying problem, and stays constant
for experiments with various sample sizes. Thus, we may choose various
values of T, as Y,,. . . , ru, and measure 2. Computing r as the average of
several independent trials, we may solve (5.71) for E and v by a line fit tech-
nique.
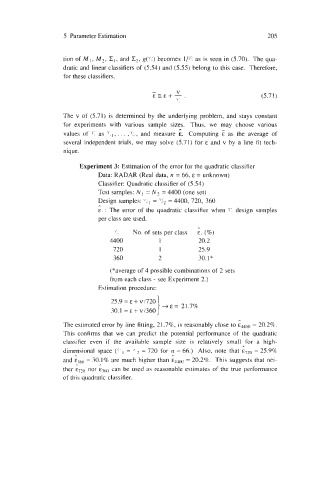
Experiment 3: Estimation of the error for the quadratic classifier
Data: RADAR (Real data, n = 66, E = unknown)
Classifier: Quadratic classifier of (5.54)
Test samples: N I = N2 = 4400 (one set)
Design samples: (L, = Yc2 = 4400, 720, 360
,.
E : The error of the quadratic classifier when design samples
per class are used.
,.
rV No. of sets per class E (%)
4400 1 20.2
720 1 25.9
360 2 30.1 *
(*average of 4 possible combinations of 2 sets
from each class - see Experiment 2.)
Ectimation procedure:
25.9 = E + v 1720 +E= 21.7%
30.1 =~+~1360
The estimated error by line fitting, 21.7%, is reasonably close to = 20.2%.
This confirms that we can predict the potential performance of the quadratic
classifier even if the available sample size is relatively small for a high-
~
dimensional space (? ' , = ?? = 720 for n = 66.) Also, note that E ~ = ~25.9% )
=
and E ~ = ~30. I % are much higher than E~~(~) 20.2%. This suggests that nei-
~
)
ther nor E~~(, can be uscd as reasonable estimates of the true performance
of this quadratic classifier.