
Page 265 - Introduction to Statistical Pattern Recognition
P. 265
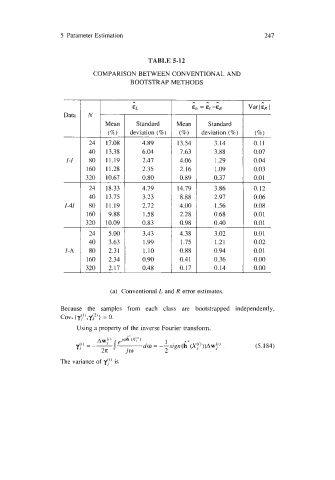
5  Parameter Estimation                                       247


                                              TABLE 5-12
                             COMPARISON BETWEEN CONVENTIONAL AND
                                        BOOTSTRAP METHODS

                                         ..
                                         EL
                    Data    N
                                 Mean     Standard    Mean      Standard
                                  (%)
                          -             deviation (%)   (%)   deviation (%)   (%)
                            24   17.08      4.89       13.54      3.14        0.1 1
                            40   13.38      6.04       7.63       3.88        0.07
                     1-1    80   11.19      2.47       4.06       1.29        0.04
                           160   11.28      2.35       2.16       1.09        0.03
                           320   10.67      0.80       0.89       0.37        0.0 1
                            24   18.33      4.79       14.79      3.86        0.12
                            40   13.75      3.23       8.88       2.97        0.06
                     1-41   80   11.19      2.72       4.00       1.56        0.08
                           160    9.88      1.58       2.28       0.68        0.01
                           3 20
                                 10.09
                          -                 0.83       0.98       0.40        0.01
                            24    5 .oo     3.43       4.38       3.02        0.0 1
                            40    3.63      1.99        1.75      1.21        0.02
                     I-A    80    2.3  1    1.10       0.88       0.94        0.01
                           160    2.34      0.90       0.4  1     0.36        0.00
                           320    2.17      0.48       0.17       0.14        0.00


                                  (a)  Conventional L and R error estimates.

                   Because  the  samples  from  each  class  are  bootstrapped  independently,
                   cOv*{yy),yp}  = 0.
                        Using a property of the inverse Fourier transform,

                                                                              (5.184)

                   The variance of y)’’ is