
Page 266 - Introduction to Statistical Pattern Recognition
P. 266
248 Introduction to Statistical Pattern Recognition
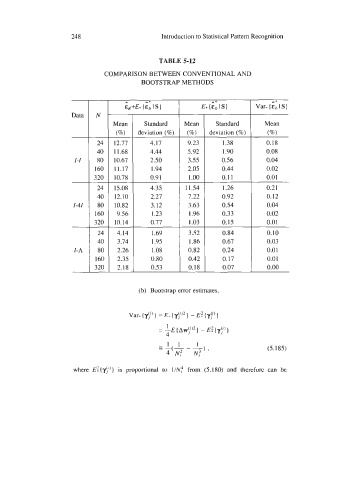
TABLE 5-12
COMPARISON BETWEEN CONVENTIONAL AND
BOOTSTRAP METHODS
-
-
A*
Var, ( E,, IS)
Data N
Mean ZzJ-5 Standard Standard Mean
(%I deviation (%)
24 12.77 4.17 9.23 1.38 0.18
40 1 1.68 4.44 5.92 1.90 0.08
1-1 80 10.67 2.50 3.55 0.56 0.04
160 11.17 1.94 2.05 0.44 0.02
320 10.78 0.9 1 1 .oo 0.1 1 0.0 1
24 15.08 4.35 11.54 1.26 0.2 1
40 12.10 2.27 7.22 0.92 0.12
1-41 80 10.82 3.12 3.63 0.54 0.04
160 9.56 1.23 1.96 0.33 0.02
10.14
320
- - 0.77 1.03 0. I5 0.0 1
24 4.14 1.69 3.52 0.84 0.10
40 3.74 1.95 I .86 0.67 0.03
I-A 80 2.26 1.08 0.82 0.24 0.0 1
160 2.35 0.80 0.42 0.17 0.0 1
3 20 2.18 0.53 0.18 0.07 0.00
(b) Bootstrap error estimates.
(5.185)
where E:{yY)] is proportional to 1/NP from (5.180) and therefore can be