
Page 80 - Introduction to Statistical Pattern Recognition
P. 80
62 Introduction to Statistical Pattern Recognition
(3.35)
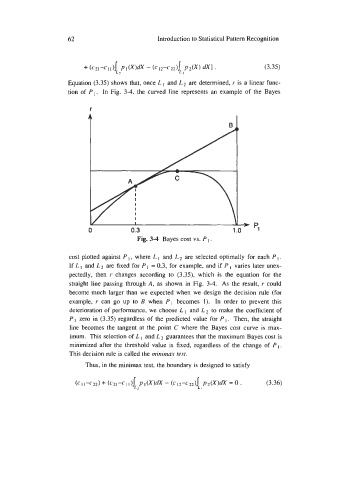
Equation (3.35) shows that, once L and L2 are determined, r is a linear func-
tion of P,. In Fig. 3-4, the curved Iine represents an example of the Bayes
Fig. 3-4 Bayes cost vs. P
cost plotted against PI, where LI and L2 are selected optimally for each PI.
If LI and L2 are fixed for PI = 0.3, for example, and if PI varies later unex-
pectedly, then I' changes according to (3.33, which is the equation for the
straight line passing through A, as shown in Fig. 3-4. As the result, I' could
become much larger than we expected when we design the decision rule (for
example, I' can go up to B when PI becomes 1). In order to prevent this
deterioration of performance, we choose L 1 and L2 to make the coefficient of
P zero in (3.35) regardless of the predicted value for P Then, the straight
line becomes the tangent at the point C where the Bayes cost curve is max-
imum. This selection of L and L2 guarantees that the maximum Bayes cost is
minimized after the threshold value is fixed, regardless of the change of PI.
This decision rule is called the minimax rest.
Thus, in the minimax test, the boundary is designed to satisfy