
Page 112 - Materials Chemistry, Second Edition
P. 112
96 3 Life Cycle Inventory Analysis
The reason for the mass flow as indicated is owing to the fact that Cl leaves
2
the system as co-product. Thus only 52.3% of the environmental loads of the NaCl
production can be allocated to NaOH production. If for the production of LAS
127 kg of NaOH are necessary, a stoichiometric 186 kg of NaCl are required for
the process of chlorine alkali electrolysis. Of these, however, only 97.3 kg (52.3%)
are allocated to sodium hydroxide according to an allocation per mass. If H is
2
not considered for allocation (remains in the system) the indicated 99 kg of the
ECOSOL study results.
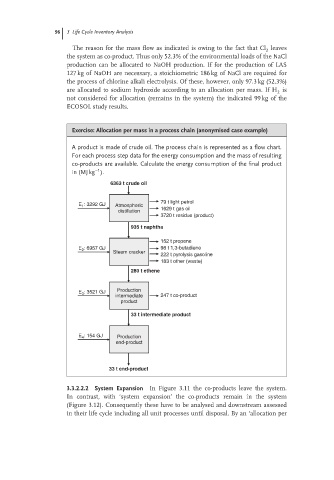
Exercise: Allocation per mass in a process chain (anonymised case example)
A product is made of crude oil. The process chain is represented as a flow chart.
For each process step data for the energy consumption and the mass of resulting
co-products are available. Calculate the energy consumption of the final product
−1
in (MJ kg ).
6363 t crude oil
79 t light petrol
E 1 : 3292 GJ Atmospheric
distillation 1629 t gas oil
3720 t residue (product)
935 t naphtha
152 t propene
E 2 : 6957 GJ 98 t 1,3-butadiene
Steam cracker
222 t pyrolysis gasoline
183 t other (waste)
280 t ethene
Production
E 3 : 3521 GJ
intermediate 247 t co-product
product
33 t intermediate product
E 4 : 154 GJ Production
end-product
33 t end-product
3.3.2.2.2 System Expansion In Figure 3.11 the co-products leave the system.
In contrast, with ‘system expansion’ the co-products remain in the system
(Figure 3.12). Consequently these have to be analysed and downstream assessed
in their life cycle including all unit processes until disposal. By an ‘allocation per