
Page 110 - Materials Chemistry, Second Edition
P. 110
94 3 Life Cycle Inventory Analysis
Stuart Mill 80) is said to have been the first to recognise the problem of allocation,
and illustrated it by the following example:
Chicken (→ meat)∕Eggs
Similarly descriptive allocations are, for example, with cattle:
Meat∕tallow(→ soap)∕skin(→ leathers)
Before proposals for a solution of the allocation problem are presented in Section
3.3.2.3, the following two important strategies are discussed: ‘allocation per mass’,
the oldest and still the method of choice for many multi-output processes and
‘system expansion’, recommended by ISO 14044.
3.3.2.2.1 Allocation per Mass The allocation per mass requires that all inputs and
all outputs are partitioned according to the mass ratio of the co-products formed. If,
for example a unit process with two co-products A and B (see Figure 3.10) results in
700 kg A and 300 kg B per fU, according to this rule 700/(700 + 300) = 0.7 or 70%
of all emissions, energy consumption, ancillary materials, and so on, are attributed
to A and 30% to B. It is important to note that, for a consideration of multiple unit
processes, the allocation per mass has to be made for all upstream unit processes.
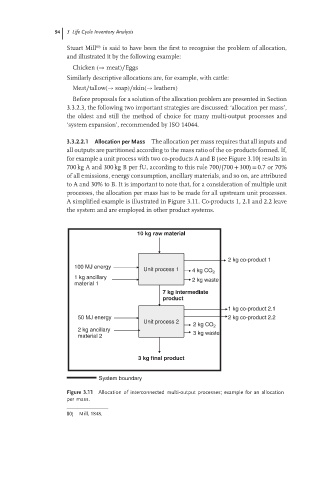
A simplified example is illustrated in Figure 3.11. Co-products 1, 2.1 and 2.2 leave
the system and are employed in other product systems.
10 kg raw material
2 kg co-product 1
100 MJ energy
Unit process 1 4 kg CO 2
1 kg ancillary 2 kg waste
material 1
7 kg intermediate
product
1 kg co-product 2.1
50 MJ energy 2 kg co-product 2.2
Unit process 2
2 kg CO 2
2 kg ancillary 3 kg waste
material 2
3 kg final product
System boundary
Figure 3.11 Allocation of interconnected multi-output processes; example for an allocation
per mass.
80) Mill, 1848.