
Page 260 - Materials Chemistry, Second Edition
P. 260
244 4 Life Cycle Impact Assessment
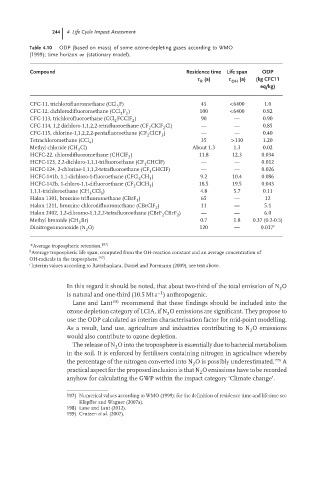
Table 4.10 ODP (based on mass) of some ozone-depleting gases according to WMO
(1999); time horizon ∞ (stationary model).
Compound Residence time Life span ODP
(a) (a) (kg CFC11
R OH
eq/kg)
CFC-11, trichlorofluoromethane (CCl F) 45 <6400 1.0
3
CFC-12, dichlorodifluoromethane (CCl F ) 100 <6400 0.82
2 2
CFC-113, trichlorofluoroethane (CCl FCClF ) 90 — 0.90
2 2
CFC-114, 1,2 dichloro-1,1,2,2-tetrafluoroethane (CF ClCF Cl) — — 0.85
2
2
CFC-115, chlorine-1,1,2,2,2-pentafluoroethane (CF ClCF ) — — 0.40
2 3
Tetrachloromethane (CCl ) 35 >130 1.20
4
Methyl chloride (CH Cl) About 1.3 1.3 0.02
3
HCFC-22, chlorodifluoromethane (CHClF ) 11.8 12.3 0.034
2
HCFC-123, 2,2-dichloro-1,1,1-trifluoroethane (CF CHClF) — — 0.012
3
HCFC-124, 2-chlorine-1,1,1,2-tetrafluoroethane (CF CHClF) — — 0.026
3
HCFC-141b, 1,1-dichloro-1-fluoroethane (CFCl CH ) 9.2 10.4 0.086
2
3
HCFC-142b, 1-chloro-1,1-difluoroethane (CF ClCH ) 18.5 19.5 0.043
2 3
1,1,1-trichloroethane (CH CCl ) 4.8 5.7 0.11
3
3
Halon 1301, bromine trifluoromethane (CBrF ) 65 — 12
3
Halon 1211, bromine chlorodifluoromethane (CBrClF ) 11 — 5.1
2
Halon 2402, 1,2-dibromo-1,1,2,2-tetrafluoroethane (CBrF CBrF ) — — 6.0
2 2
Methyl bromide (CH Br) 0.7 1.8 0.37 (0.2-0.5)
3
Dinitrogenmonoxide (N O) 120 — 0.017 c
2
a Average tropospheric retention. 197)
b
Average tropospheric life span, computed from the OH-reaction constant and an average concentration of
OH-radicals in the troposphere. 197)
c
Interim values according to Ravishankara, Daniel and Portmann (2009), see text above.
In this regard it should be noted, that about two-third of the total emission of N O
2
−1
is natural and one-third (10.5 Mt a ) anthropogenic.
Lane and Lant 198) recommend that these findings should be included into the
ozone depletion category of LCIA, if N O emissions are significant. They propose to
2
use the ODP calculated as interim characterisation factor for mid-point modelling.
As a result, land use, agriculture and industries contributing to N O emissions
2
would also contribute to ozone depletion.
The release of N O into the troposphere is essentially due to bacterial metabolism
2
in the soil. It is enforced by fertilisers containing nitrogen in agriculture whereby
the percentage of the nitrogen converted into N O is possibly underestimated. 199) A
2
practical aspect for the proposed inclusion is that N O emissions have to be recorded
2
anyhow for calculating the GWP within the impact category ‘Climate change’.
197) Numerical values according to WMO (1999); for the definition of residence time and lifetime see
Kl¨ opffer and Wagner (2007a).
198) Lane and Lant (2012).
199) Crutzen et al. (2007).