
Page 317 - Materials Chemistry, Second Edition
P. 317
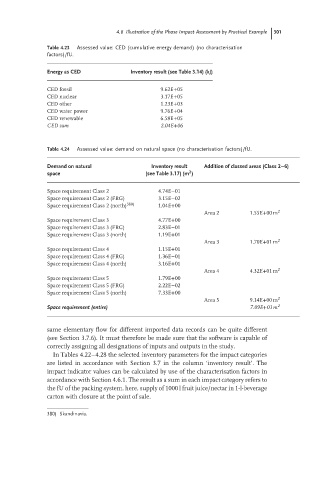
4.6 Illustration of the Phase Impact Assessment by Practical Example  301

               Table 4.23  Assessed value: CED (cumulative energy demand) (no characterisation
               factors)/fU.

               Energy as CED           Inventory result (see Table 3.14) (kJ)


               CED fossil                      9.62E+05
               CED nuclear                     3.17E+05
               CED other                       1.23E+03
               CED water power                 9.76E+04
               CED renewable                   6.58E+05
               CED sum                         2.04E+06


               Table 4.24  Assessed value: demand on natural space (no characterisation factors)/fU.


               Demand on natural             Inventory result  Addition of classed areas (Class 2–6)
                                                        2
               space                       (see Table 3.17) (m )
               Space requirement Class 2       4.74E−01
               Space requirement Class 2 (FRG)  3.15E−02
               Space requirement Class 2 (north) 380)  1.04E+00
                                                            Area 2       1.55E+00 m 2
               Space requirement Class 3       4.77E+00
               Space requirement Class 3 (FRG)  2.83E−01
               Space requirement Class 3 (north)  1.19E+01
                                                            Area 3       1.70E+01 m 2
               Space requirement Class 4       1.15E+01
               Space requirement Class 4 (FRG)  1.36E−01
               Space requirement Class 4 (north)  3.16E+01
                                                            Area 4       4.32E+01 m 2
               Space requirement Class 5       1.79E+00
               Space requirement Class 5 (FRG)  2.22E−02
               Space requirement Class 5 (north)  7.33E+00
                                                            Area 5       9.14E+00 m 2
               Space requirement (entire)                                7.09E+01 m 2


               same elementary flow for different imported data records can be quite different
               (see Section 3.7.6). It must therefore be made sure that the software is capable of
               correctly assigning all designations of inputs and outputs in the study.
                In Tables 4.22–4.28 the selected inventory parameters for the impact categories
               are listed in accordance with Section 3.7 in the column ‘inventory result’. The
               impact indicator values can be calculated by use of the characterisation factors in
               accordance with Section 4.6.1. The result as a sum in each impact category refers to
               the fU of the packing system, here, supply of 1000 l fruit juice/nectar in 1-l-beverage
               carton with closure at the point of sale.

               380) Skandinavia.