
Page 319 - Materials Chemistry, Second Edition
P. 319
4.6 Illustration of the Phase Impact Assessment by Practical Example 303
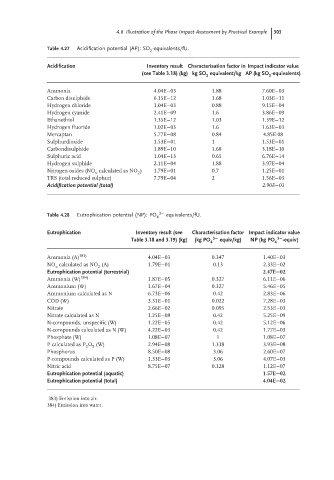
Table 4.27 Acidification potential (AP): SO -equivalents/fU.
2
Acidification Inventory result Characterisation factor in Impact indicator value
(see Table 3.18) (kg) kg SO equivalent/kg AP (kg SO -equivalents)
2 2
Ammonia 4.04E−03 1.88 7.60E−03
Carbon disulphide 6.15E−12 1.68 1.03E−11
Hydrogen chloride 1.04E−03 0.88 9.15E−04
Hydrogen cyanide 2.41E−09 1.6 3.86E−09
Ethanethiol 1.35E−12 1.03 1.39E−12
Hydrogen fluoride 1.02E−03 1.6 1.63E−03
Mercaptan 5.77E−08 0.84 4.85E-08
Sulphurdioxide 1.53E−01 1 1.53E−01
Carbondisulphide 1.89E−10 1.68 3.18E−10
Sulphuric acid 1.04E−13 0.65 6.76E−14
Hydrogen sulphide 2.11E−04 1.88 3.97E−04
Nitrogen oxides (NO calculated as NO ) 1.79E−01 0.7 1.25E−01
x 2
TRS (total reduced sulphur) 7.79E−04 2 1.56E−03
Acidification potential (total) 2.90E−01
Table 4.28 Eutrophication potential (NP): PO 4 3− equivalents/fU.
Eutrophication Inventory result (see Characterisation factor Impact indicator value
Table 3.18 and 3.19) (kg) (kg PO 4 3− equiv/kg) NP (kg PO 4 3− -equiv)
Ammonia (A) 383) 4.04E−03 0.347 1.40E−03
NO calculated as NO (A) 1.79E−01 0.13 2.33E−02
2
x
Eutrophication potential (terrestrial) 2.47E−02
Ammonia (W) 384) 1.87E−05 0.327 6.11E−06
Ammonium (W) 1.67E−04 0.327 5.46E−05
Ammonium calculated as N 6.73E−06 0.42 2.83E−06
COD (W) 3.31E−01 0.022 7.28E−03
Nitrate 2.66E−02 0.095 2.53E−03
Nitrate calculated as N 1.25E−08 0.42 5.25E−09
N-compounds, unspecific (W) 1.22E−05 0.42 5.12E−06
N-compounds calculated as N (W) 4.22E−03 0.42 1.77E−03
Phosphate (W) 1.08E−07 1 1.08E−07
P calculated as P O (W) 2.94E−08 1.338 3.93E−08
5
2
Phosphorus 8.50E−08 3.06 2.60E−07
P-compounds calculated as P (W) 1.33E−03 3.06 4.07E−03
Nitric acid 8.75E−07 0.128 1.12E−07
Eutrophication potential (aquatic) 1.57E−02
Eutrophication potential (total) 4.04E−02
383) Emission into air.
384) Emission into water.