
Page 323 - Materials Chemistry, Second Edition
P. 323
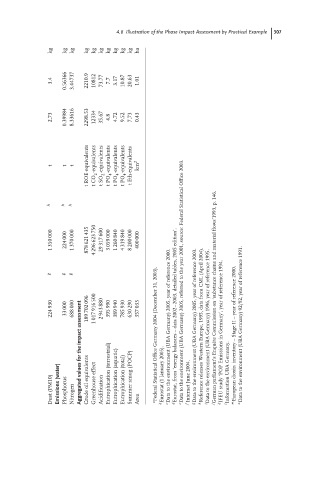
4.6 Illustration of the Phase Impact Assessment by Practical Example  307


                kg  kg  kg  kg  kg  kg  kg  kg  kg  kg  ha


                3.4  0.56366  3.44737  2210.9  10812  73.77  7.7  3.17  10.87  20.63  1.01


                2.73  0.39984  8.33616  2298.53  12334  35.67  4.8  4.72  9.52  7.73  0.43


                t   t  t  t ROE-equivalents  t CO 2 -equivalents  t SO 2 -equivalents  t PO 4 -equivalents  t PO 4 -equivalents  t PO 4 -equivalents  t Eth-equivalents  km 2


               h    h  h


                1 350 000  224 000  1 370 000  878 621 435  4 296 623 750  29 317 600  3 059 000  1 260 840  4 319 840  8 200 000  400 000


               g    g  g                             e Data to the environment (UBA Germany) 2005, referred to the year 2001, source: Federal Statistical Office 2003.  ete Commission on ‘substance chains and material flows’1993, p. 146.


                224 930  33 000  688 000  189 702 096  1 017 916 500  2 943 880  395 990  389 940  785 930  630 290  357 033 a Federal Statistical Office Germany 2004 (December 31, 2003). c Data to the environment (UBA Germany) 2005, year of reference 2000. d Eurostat, from ‘energy balances – data 2002–2003, detailed tables, 2005 edition’. g Data to the environment (UBA Germany) 200


                Dust (PM10)  Emissions (water)  Phosphorus  Nitrogen Aggregated values for the impact assessment  Crude oil equivalents  Greenhouse effect  Acidification Eutrophication (terrestrial) Eutrophication (aquatic)  Eutrophication (total)  Summer smog (POCP)  Area  b Eurostat (1 January 2005).  f Internet June 2004.  j German parliament’s Enqu`  l Information UBA Germany.