
Page 320 - Materials Chemistry, Second Edition
P. 320
304 4 Life Cycle Impact Assessment
Table 4.29 Tabular presentation of the results of the impact assessment after the stage of
characterisation.
Indicator Result Unit
Sum: raw oil equivalents 17.66 kg ROE
Sum CED 2.04E+06 kJ
Space requirement (total) 7.09E+01 m 2
Global warming potential (GWP 100 ) 6.83E+01 kg CO -equivalents
2
Summer smog potential (POCP) 3.69E−02 kg of Ethene equivalents
Acidification potential (AP) 2.90E−01 kg SO - equivalents
2
Eutrophication potential (NP aquatic) 1.57E−02 kg PO 3− - equivalents
4
Eutrophication potential (NP terrestrial) 2.47E−02 kg PO 4 3− - equivalents
As the final result of the classification the inventory data are bundled and
thus prepared for the interpretation: Many data of the inventory are however
not transferred into impact indicators. If in a study the categories human- and
eco-toxicity are considered, further data of the inventory could be consulted. As
described above in the sample study these impact categories were not included
because of controversial discussions in professional circles (see also Section 4.5).
Table 4.29 shows the summation of results of impact categories considered and
additionally, the two inventory figures ‘CED’ and ‘space requirement’.
In Section 2.3.1 the goals outlined in the sample study were indicated. In order
to be able to redeem these goals the data are further prepared by Normalisation for
the interpretation (see Section 4.6.4).
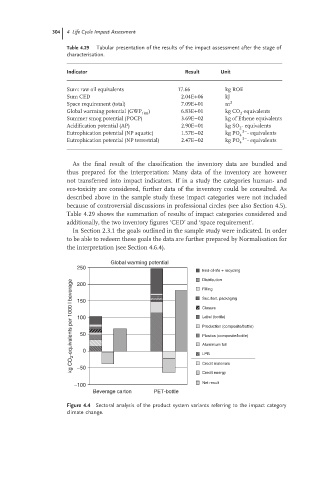
Global warming potential
250
End-of-life + recycling
Distribution
kg CO 2 -equivalents per 1000 l beverage 150 0 Sec./tert. packaging
200
Filling
Closure
100
Label (bottle)
Production (composite/bottle)
50
Plastics (composite/bottle)
Aluminium foil
LPB
Credit materials
−50
Credit energy
Net result
−100
Beverage carton PET-bottle
Figure 4.4 Sectoral analysis of the product system variants referring to the impact category
climate change.