
Page 360 - Materials Chemistry, Second Edition
P. 360
344 5 Life Cycle Interpretation, Reporting and Critical Review
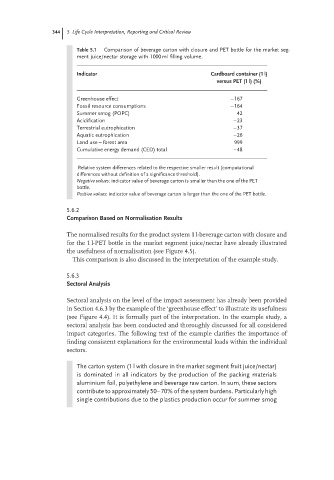
Table 5.1 Comparison of beverage carton with closure and PET bottle for the market seg-
ment juice/nectar storage with 1000 ml filling volume.
Indicator Cardboard container (1 l)
versus PET (1 l) (%)
Greenhouse effect −167
Fossil resource consumptions −164
Summer smog (POPC) 42
Acidification −23
Terrestrial eutrophication −37
Aquatic eutrophication −26
Land use – forest area 999
Cumulative energy demand (CED) total −48
Relative system differences related to the respective smaller result (computational
differences without definition of a significance threshold).
Negative values: indicator value of beverage carton is smaller than the one of the PET
bottle.
Positive values: indicator value of beverage carton is larger than the one of the PET bottle.
5.6.2
Comparison Based on Normalisation Results
The normalised results for the product system 1 l-beverage carton with closure and
for the 1 l-PET bottle in the market segment juice/nectar have already illustrated
the usefulness of normalisation (see Figure 4.5).
This comparison is also discussed in the interpretation of the example study.
5.6.3
Sectoral Analysis
Sectoral analysis on the level of the impact assessment has already been provided
in Section 4.6.3 by the example of the ‘greenhouse effect’ to illustrate its usefulness
(see Figure 4.4). It is formally part of the interpretation. In the example study, a
sectoral analysis has been conducted and thoroughly discussed for all considered
impact categories. The following text of the example clarifies the importance of
finding consistent explanations for the environmental loads within the individual
sectors.
The carton system (1 l with closure in the market segment fruit juice/nectar)
is dominated in all indicators by the production of the packing materials
aluminium foil, polyethylene and beverage raw carton. In sum, these sectors
contribute to approximately 50–70% of the system burdens. Particularly high
single contributions due to the plastics production occur for summer smog