
Page 365 - Materials Chemistry, Second Edition
P. 365
5.6 Illustration of the Component Interpretation Using an Example of Practice 349
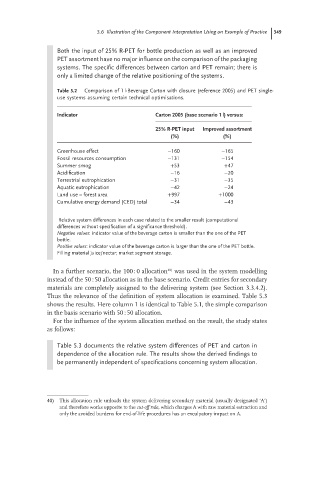
Both the input of 25% R-PET for bottle production as well as an improved
PET assortment have no major influence on the comparison of the packaging
systems. The specific differences between carton and PET remain; there is
only a limited change of the relative positioning of the systems.
Table 5.2 Comparison of 1 l-Beverage Carton with closure (reference 2005) and PET single-
use systems assuming certain technical optimisations.
Indicator Carton 2005 (base scenario 1 l) versus:
25% R-PET input Improved assortment
(%) (%)
Greenhouse effect −160 −165
Fossil resources consumption −131 −154
Summer smog +53 +47
Acidification −16 −20
Terrestrial eutrophication −31 −35
Aquatic eutrophication −42 −24
Land use – forest area +997 +1000
Cumulative energy demand (CED) total −34 −43
Relative system differences in each case related to the smaller result (computational
differences without specification of a significance threshold).
Negative values: indicator value of the beverage carton is smaller than the one of the PET
bottle.
Positive values: indicator value of the beverage carton is larger than the one of the PET bottle.
Filling material juice/nectar; market segment storage.
In a further scenario, the 100 : 0 allocation 40) was used in the system modelling
instead of the 50 : 50 allocation as in the base scenario. Credit entries for secondary
materials are completely assigned to the delivering system (see Section 3.3.4.2).
Thus the relevance of the definition of system allocation is examined. Table 5.3
shows the results. Here column 1 is identical to Table 5.1, the simple comparison
in the basis scenario with 50 : 50 allocation.
For the influence of the system allocation method on the result, the study states
as follows:
Table 5.3 documents the relative system differences of PET and carton in
dependence of the allocation rule. The results show the derived findings to
be permanently independent of specifications concerning system allocation.
40) This allocation rule unloads the system delivering secondary material (usually designated ‘A’)
and therefore works opposite to the cut-off rule, which charges A with raw material extraction and
only the avoided burdens for end-of-life procedures has an exculpatory impact on A.