
Page 88 - Materials Chemistry, Second Edition
P. 88
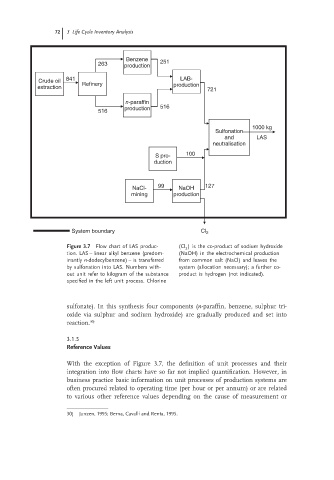
72  3 Life Cycle Inventory Analysis


                                     Benzene   251
                             263     production

                    841                              LAB-
            Crude oil
            extraction   Refinery                  production
                                                             721
                                     n-paraffin
                                     production  516
                             516
                                                                          1000 kg
                                                               Sulfonation
                                                                  and      LAS
                                                              neutralisation
                                              S pro-   100
                                             duction


                                               99           127
                                       NaCl-         NaOH
                                       mining      production


                      System boundary                      Cl 2

                    Figure 3.7  Flow chart of LAS produc-  (Cl ) is the co-product of sodium hydroxide
                                                       2
                    tion. LAS – linear alkyl benzene (predom-  (NaOH) in the electrochemical production
                    inantly n-dodecylbenzene) – is transferred  from common salt (NaCl) and leaves the
                    by sulfonation into LAS. Numbers with-  system (allocation necessary); a further co-
                    out unit refer to kilogram of the substance  product is hydrogen (not indicated).
                    specified in the left unit process. Chlorine


                    sulfonate). In this synthesis four components (n-paraffin, benzene, sulphur tri-
                    oxide via sulphur and sodium hydroxide) are gradually produced and set into
                    reaction. 30)

                    3.1.5
                    Reference Values

                    With the exception of Figure 3.7, the definition of unit processes and their
                    integration into flow charts have so far not implied quantification. However, in
                    business practice basic information on unit processes of production systems are
                    often procured related to operating time (per hour or per annum) or are related
                    to various other reference values depending on the cause of measurement or

                    30)  Janzen, 1995; Berna, Cavalli and Renta, 1995.