
Page 89 - Materials Chemistry, Second Edition
P. 89
3.1 Basics 73
procurement of the data. In LCI data have to be related to the part of the output
relevant to the production of the assessed product, and therefore the original data
used in the inventory have to be converted accordingly.
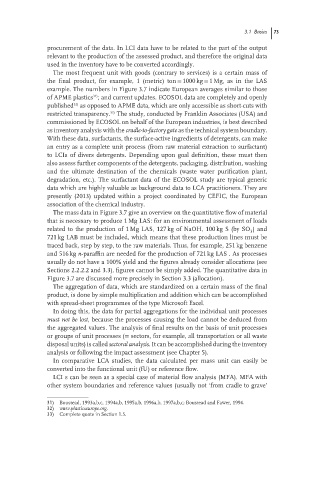
The most frequent unit with goods (contrary to services) is a certain mass of
the final product, for example, 1 (metric) ton = 1000 kg = 1 Mg, as in the LAS
example. The numbers in Figure 3.7 indicate European averages similar to those
31)
of APME plastics ; and current updates. ECOSOL data are completely and openly
published 32) as opposed to APME data, which are only accessible as short-cuts with
restricted transparency. 33) The study, conducted by Franklin Associates (USA) and
commissioned by ECOSOL on behalf of the European industries, is best described
as inventory analysis with the cradle-to-factory gate as the technical system boundary.
With these data, surfactants, the surface-active ingredients of detergents, can make
an entry as a complete unit process (from raw material extraction to surfactant)
to LCIs of divers detergents. Depending upon goal definition, these must then
also assess further components of the detergents, packaging, distribution, washing
and the ultimate destination of the chemicals (waste water purification plant,
degradation, etc.). The surfactant data of the ECOSOL study are typical generic
data which are highly valuable as background data to LCA practitioners. They are
presently (2013) updated within a project coordinated by CEFIC, the European
association of the chemical industry.
The mass data in Figure 3.7 give an overview on the quantitative flow of material
that is necessary to produce 1 Mg LAS: for an environmental assessment of loads
related to the production of 1 Mg LAS, 127 kg of NaOH, 100 kg S (by SO )and
3
721 kg LAB must be included, which means that these production lines must be
traced back, step by step, to the raw materials. Thus, for example, 251 kg benzene
and 516 kg n-paraffin are needed for the production of 721 kg LAS . As processes
usually do not have a 100% yield and the figures already consider allocations (see
Sections 2.2.2.2 and 3.3), figures cannot be simply added. The quantitative data in
Figure 3.7 are discussed more precisely in Section 3.3 (allocation).
The aggregation of data, which are standardized on a certain mass of the final
product, is done by simple multiplication and addition which can be accomplished
with spread-sheet programmes of the type Microsoft Excel.
In doing this, the data for partial aggregations for the individual unit processes
must not be lost, because the processes causing the load cannot be deduced from
the aggregated values. The analysis of final results on the basis of unit processes
or groups of unit processes (= sectors, for example, all transportation or all waste
disposalunits)iscalled sectoral analysis. It can be accomplished during the inventory
analysis or following the impact assessment (see Chapter 5).
In comparative LCA studies, the data calculated per mass unit can easily be
converted into the functional unit (fU) or reference flow.
LCI s can be seen as a special case of material flow analysis (MFA). MFA with
other system boundaries and reference values (usually not ‘from cradle to grave’
31) Boustead, 1993a,b,c, 1994a,b, 1995a,b, 1996a,b, 1997a,b,c; Boustead and Fawer, 1994.
32) www.plasticseurope.org.
33) Complete quote in Section 1.5.