
Page 92 - Materials Chemistry, Second Edition
P. 92
76 3 Life Cycle Inventory Analysis
It is easy to realize that the real (final) energy demand will be higher due to losses.
If the process energy was spent in the form of electricity (1 MJ = 0.278 kWh), the
primary energy with predominantly thermal power generation is around a factor
2–3 higher, because, according to the second principle of thermodynamics, the
maximum efficiency amounts to
(T –T )
= 2 1 (3.2)
T 2
Here T is the upper and T the lower temperature (K) of the thermal engine
2 1
(Carnot cycle).
Whereas the physical conversion results in 1 kWh = 3.6 MJ, the conversion under
consideration of the second principle (thermal) as rough approximation amounts to
1kWh (electrical final energy)≈ 10MJ (primary energy)
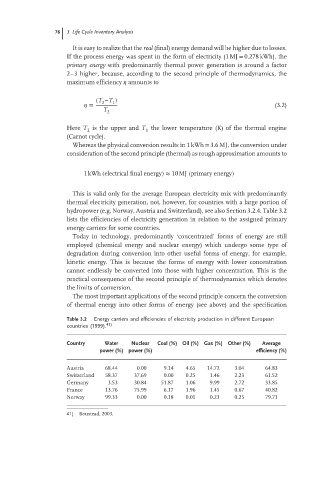
This is valid only for the average European electricity mix with predominantly
thermal electricity generation, not, however, for countries with a large portion of
hydropower (e.g. Norway, Austria and Switzerland), see also Section 3.2.4. Table 3.2
lists the efficiencies of electricity generation in relation to the assigned primary
energy carriers for some countries.
Today in technology, predominantly ‘concentrated’ forms of energy are still
employed (chemical energy and nuclear energy) which undergo some type of
degradation during conversion into other useful forms of energy, for example,
kinetic energy. This is because the forms of energy with lower concentration
cannot endlessly be converted into those with higher concentration. This is the
practical consequence of the second principle of thermodynamics which denotes
the limits of conversion.
The most important applications of the second principle concern the conversion
of thermal energy into other forms of energy (see above) and the specification
Table 3.2 Energy carriers and efficiencies of electricity production in different European
countries (1999). 41)
Country Water Nuclear Coal (%) Oil (%) Gas (%) Other (%) Average
power (%) power (%) efficiency (%)
Austria 68.44 0.00 9.14 4.65 14.72 3.04 64.83
Switzerland 58.37 37.69 0.00 0.25 1.46 2.23 61.52
Germany 3.53 30.84 51.87 1.06 9.99 2.72 33.85
France 13.76 75.99 6.17 1.96 1.45 0.67 40.82
Norway 99.33 0.00 0.18 0.01 0.23 0.25 79.71
41) Boustead, 2003.