
Page 248 - Materials Chemistry, Second Edition
P. 248
234 R.K. Rosenbaum et al.
It should be noted that only impacts on cold-blooded species in freshwater
ecosystems are currently considered. There is no minimum requirement established,
which trophic levels should be covered by a characterisation factor for terrestrial or
marine ecosystems and available methods usually extrapolate from freshwater data
or use the relatively few data available directly for these ecosystems.
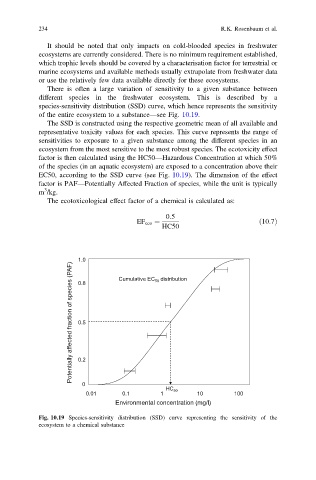
There is often a large variation of sensitivity to a given substance between
different species in the freshwater ecosystem. This is described by a
species-sensitivity distribution (SSD) curve, which hence represents the sensitivity
of the entire ecosystem to a substance—see Fig. 10.19.
The SSD is constructed using the respective geometric mean of all available and
representative toxicity values for each species. This curve represents the range of
sensitivities to exposure to a given substance among the different species in an
ecosystem from the most sensitive to the most robust species. The ecotoxicity effect
factor is then calculated using the HC50—Hazardous Concentration at which 50%
of the species (in an aquatic ecosystem) are exposed to a concentration above their
EC50, according to the SSD curve (see Fig. 10.19). The dimension of the effect
factor is PAF—Potentially Affected Fraction of species, while the unit is typically
3
m /kg.
The ecotoxicological effect factor of a chemical is calculated as:
0:5
EF eco ¼ ð10:7Þ
HC50
1.0 Cumulative EC 50 distribution
Potentially affected fraction of species (PAF) 0.5
0.8
0.2
0
HC 50
0.01 0.1 1 10 100
Environmental concentration (mg/l)
Fig. 10.19 Species-sensitivity distribution (SSD) curve representing the sensitivity of the
ecosystem to a chemical substance