
Page 297 - Materials Chemistry, Second Edition
P. 297
11 Uncertainty Management and Sensitivity Analysis 283
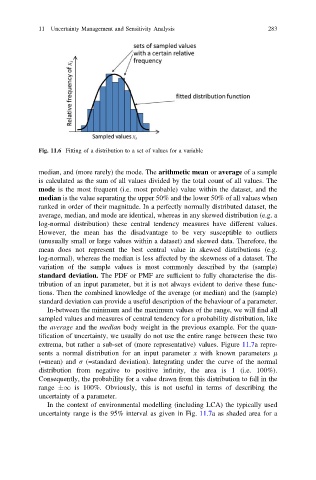
Fig. 11.6 Fitting of a distribution to a set of values for a variable
median, and (more rarely) the mode. The arithmetic mean or average of a sample
is calculated as the sum of all values divided by the total count of all values. The
mode is the most frequent (i.e. most probable) value within the dataset, and the
median is the value separating the upper 50% and the lower 50% of all values when
ranked in order of their magnitude. In a perfectly normally distributed dataset, the
average, median, and mode are identical, whereas in any skewed distribution (e.g. a
log-normal distribution) these central tendency measures have different values.
However, the mean has the disadvantage to be very susceptible to outliers
(unusually small or large values within a dataset) and skewed data. Therefore, the
mean does not represent the best central value in skewed distributions (e.g.
log-normal), whereas the median is less affected by the skewness of a dataset. The
variation of the sample values is most commonly described by the (sample)
standard deviation. The PDF or PMF are sufficient to fully characterise the dis-
tribution of an input parameter, but it is not always evident to derive these func-
tions. Then the combined knowledge of the average (or median) and the (sample)
standard deviation can provide a useful description of the behaviour of a parameter.
In-between the minimum and the maximum values of the range, we will find all
sampled values and measures of central tendency for a probability distribution, like
the average and the median body weight in the previous example. For the quan-
tification of uncertainty, we usually do not use the entire range between these two
extrema, but rather a sub-set of (more representative) values. Figure 11.7a repre-
sents a normal distribution for an input parameter x with known parameters l
(=mean) and r (=standard deviation). Integrating under the curve of the normal
distribution from negative to positive infinity, the area is 1 (i.e. 100%).
Consequently, the probability for a value drawn from this distribution to fall in the
range 1 is 100%. Obviously, this is not useful in terms of describing the
uncertainty of a parameter.
In the context of environmental modelling (including LCA) the typically used
uncertainty range is the 95% interval as given in Fig. 11.7a as shaded area for a