
Page 129 - Materials Chemistry, Second Edition
P. 129
110 Life Cycle Assessment of Wastewater Treatment
This slight decay could be due to the reduction of the enzyme activity, since it
gradually decreased during the first five cycles, and then 50% of the initial activity
was maintained until the end of the operation. Kunamneni et al. (2008) studied the
decolorization of Methyl Green by laccase immobilized on epoxy-activated carriers,
and they found that the biocatalyst could oxidase five cycles in a fixed-bed reactor,
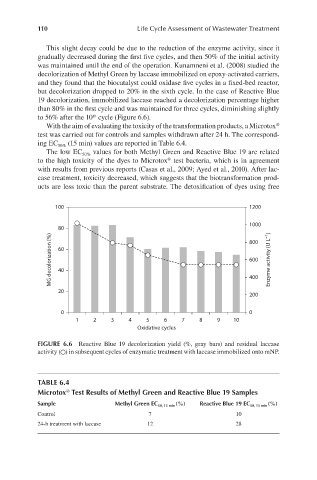
but decolorization dropped to 20% in the sixth cycle. In the case of Reactive Blue
19 decolorization, immobilized laccase reached a decolorization percentage higher
than 80% in the first cycle and was maintained for three cycles, diminishing slightly
th
to 56% after the 10 cycle (Figure 6.6).
With the aim of evaluating the toxicity of the transformation products, a Microtox
®
test was carried out for controls and samples withdrawn after 24 h. The correspond-
ing EC 50% (15 min) values are reported in Table 6.4.
The low EC 50% values for both Methyl Green and Reactive Blue 19 are related
to the high toxicity of the dyes to Microtox test bacteria, which is in agreement
®
with results from previous reports (Casas et al., 2009; Ayed et al., 2010). After lac-
case treatment, toxicity decreased, which suggests that the biotransformation prod-
ucts are less toxic than the parent substrate. The detoxification of dyes using free
100 1200
1000
80 800
MG decolorization (%) 60 600 Enzyme activity (U L –1 )
40
20 400
200
0 0
1 2 3 4 5 6 7 8 9 10
Oxidative cycles
FIGURE 6.6 Reactive Blue 19 decolorization yield (%, gray bars) and residual laccase
activity (○) in subsequent cycles of enzymatic treatment with laccase immobilized onto mNP.
TABLE 6.4
®
Microtox Test Results of Methyl Green and Reactive Blue 19 Samples
Sample Methyl Green EC 50, 15 min (%) Reactive Blue 19 EC 50, 15 min (%)
Control 7 10
24-h treatment with laccase 12 28