
Page 44 - Materials Chemistry, Second Edition
P. 44
Ecological Assessment 25
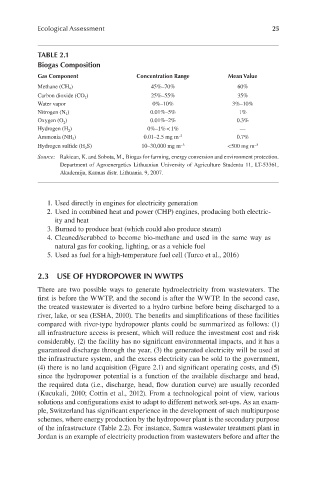
TABLE 2.1
Biogas Composition
Gas Component Concentration Range Mean Value
Methane (CH 4 ) 45%–70% 60%
Carbon dioxide (CO 2 ) 25%–55% 35%
Water vapor 0%–10% 3%–10%
Nitrogen (N 2 ) 0.01%–5% 1%
Oxygen (O 2 ) 0.01%–2% 0.3%
Hydrogen (H 2 ) 0%–1% < 1% —
Ammonia (NH 3 ) 0.01–2.5 mg m −3 0.7%
Hydrogen sulfide (H 2 S) 10–30,000 mg m −3 <500 mg m −3
Source: Rakican, K. and Sobota, M., Biogas for farming, energy conversion and environment protection.
Department of Agroenergetics Lithuanian University of Agriculture Studentu 11, LT-53361,
Akademija, Kaunas distr. Lithuania. 9, 2007.
1. Used directly in engines for electricity generation
2. Used in combined heat and power (CHP) engines, producing both electric-
ity and heat
3. Burned to produce heat (which could also produce steam)
4. Cleaned/scrubbed to become bio-methane and used in the same way as
natural gas for cooking, lighting, or as a vehicle fuel
5. Used as fuel for a high-temperature fuel cell (Turco et al., 2016)
2.3 USE OF HYDROPOWER IN WWTPS
There are two possible ways to generate hydroelectricity from wastewaters. The
first is before the WWTP, and the second is after the WWTP. In the second case,
the treated wastewater is diverted to a hydro turbine before being discharged to a
river, lake, or sea (ESHA, 2010). The benefits and simplifications of these facilities
compared with river-type hydropower plants could be summarized as follows: (1)
all infrastructure access is present, which will reduce the investment cost and risk
considerably, (2) the facility has no significant environmental impacts, and it has a
guaranteed discharge through the year, (3) the generated electricity will be used at
the infrastructure system, and the excess electricity can be sold to the government,
(4) there is no land acquisition (Figure 2.1) and significant operating costs, and (5)
since the hydropower potential is a function of the available discharge and head,
the required data (i.e., discharge, head, flow duration curve) are usually recorded
(Kucukali, 2010; Cottin et al., 2012). From a technological point of view, various
solutions and configurations exist to adapt to different network set-ups. As an exam-
ple, Switzerland has significant experience in the development of such multipurpose
schemes, where energy production by the hydropower plant is the secondary purpose
of the infrastructure (Table 2.2). For instance, Samra wastewater treatment plant in
Jordan is an example of electricity production from wastewaters before and after the