
Page 48 - Materials Chemistry, Second Edition
P. 48
Ecological Assessment 29
25
20
Discharge (m 3 /s) 15 Design discharge
10
5
0
0 10 20 30 40 50 60 70 80 90 100
Percent of time of the year indicated flows are equaled or exceeded (%)
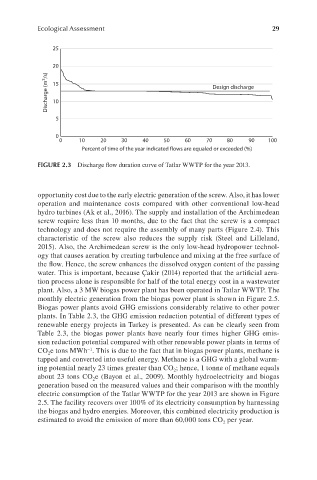
FIGURE 2.3 Discharge flow duration curve of Tatlar WWTP for the year 2013.
opportunity cost due to the early electric generation of the screw. Also, it has lower
operation and maintenance costs compared with other conventional low-head
hydro turbines (Ak et al., 2016). The supply and installation of the Archimedean
screw require less than 10 months, due to the fact that the screw is a compact
technology and does not require the assembly of many parts (Figure 2.4). This
characteristic of the screw also reduces the supply risk (Steel and Lilleland,
2015). Also, the Archimedean screw is the only low-head hydropower technol-
ogy that causes aeration by creating turbulence and mixing at the free surface of
the flow. Hence, the screw enhances the dissolved oxygen content of the passing
water. This is important, because Çakir (2014) reported that the artificial aera-
tion process alone is responsible for half of the total energy cost in a wastewater
plant. Also, a 3 MW biogas power plant has been operated in Tatlar WWTP. The
monthly electric generation from the biogas power plant is shown in Figure 2.5.
Biogas power plants avoid GHG emissions considerably relative to other power
plants. In Table 2.3, the GHG emission reduction potential of different types of
renewable energy projects in Turkey is presented. As can be clearly seen from
Table 2.3, the biogas power plants have nearly four times higher GHG emis-
sion reduction potential compared with other renewable power plants in terms of
−1
CO e tons MWh . This is due to the fact that in biogas power plants, methane is
2
tapped and converted into useful energy. Methane is a GHG with a global warm-
ing potential nearly 23 times greater than CO ; hence, 1 tonne of methane equals
2
about 23 tons CO e (Bayon et al., 2009). Monthly hydroelectricity and biogas
2
generation based on the measured values and their comparison with the monthly
electric consumption of the Tatlar WWTP for the year 2013 are shown in Figure
2.5. The facility recovers over 100% of its electricity consumption by harnessing
the biogas and hydro energies. Moreover, this combined electricity production is
estimated to avoid the emission of more than 60,000 tons CO per year.
2