
Page 357 - The ISA Handbook in Contemporary Sociology
P. 357
9781412934633-Chap-22 1/10/09 8:54 AM Page 328
328 THE ISA HANDBOOK IN CONTEMPORARY SOCIOLOGY
key agricultural commodities. New strategic by the market dynamics that continue to
alliances, mergers and takeovers, vertical and short-change them. Like hunger, the farm
horizontal integration strategies allow global crisis became a permanent feature of the
TNCs to control various segments of produc- modern food system (Qualman, 2001).
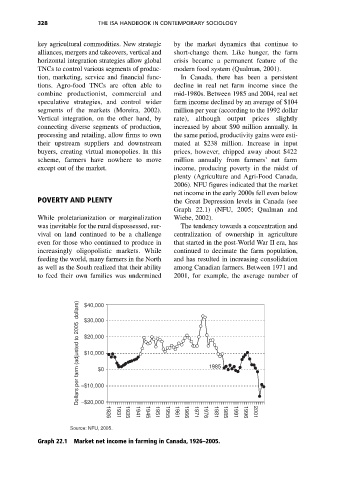
tion, marketing, service and financial func- In Canada, there has been a persistent
tions. Agro-food TNCs are often able to decline in real net farm income since the
combine productionist, commercial and mid-1980s. Between 1985 and 2004, real net
speculative strategies, and control wider farm income declined by an average of $104
segments of the markets (Moreira, 2002). million per year (according to the 1992 dollar
Vertical integration, on the other hand, by rate), although output prices slightly
connecting diverse segments of production, increased by about $90 million annually. In
processing and retailing, allow firms to own the same period, productivity gains were esti-
their upstream suppliers and downstream mated at $238 million. Increase in input
buyers, creating virtual monopolies. In this prices, however, chipped away about $422
scheme, farmers have nowhere to move million annually from farmers’ net farm
except out of the market. income, producing poverty in the midst of
plenty (Agriculture and Agri-Food Canada,
2006). NFU figures indicated that the market
net income in the early 2000s fell even below
POVERTY AND PLENTY the Great Depression levels in Canada (see
Graph 22.1) (NFU, 2005; Qualman and
While proletarianization or marginalization Wiebe, 2002).
was inevitable for the rural dispossessed, sur- The tendency towards a concentration and
vival on land continued to be a challenge centralization of ownership in agriculture
even for those who continued to produce in that started in the post-World War II era, has
increasingly oligopolistic markets. While continued to decimate the farm population,
feeding the world, many farmers in the North and has resulted in increasing consolidation
as well as the South realized that their ability among Canadian farmers. Between 1971 and
to feed their own families was undermined 2001, for example, the average number of
Dollars per farm (adjusted to 2005 dollars) −$10,000 1985
$40,000
$30,000
$20,000
$10,000
$0
−$20,000
1926
Source: NFU, 2005. 1931 1935 1941 1945 1951 1955 1961 1966 1971 1976 1981 1985 1991 1996 2001
Graph 22.1 Market net income in farming in Canada, 1926–2005.