
Page 433 -
P. 433
13.30 CHAPTER THIRTEEN
the expected life of the membrane, the feed pump must provide sufficient membrane feed
pressure throughout the design life of the system. The three main causes of time-related
performance changes are membrane fouling and scaling, membrane compaction, and mem-
brane degradation.
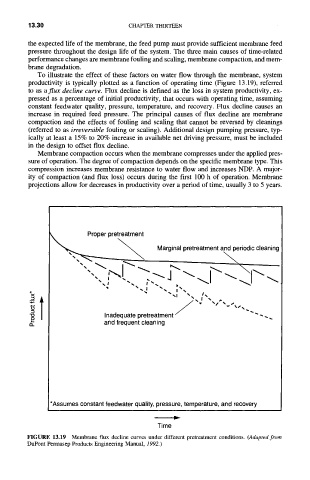
To illustrate the effect of these factors on water flow through the membrane, system
productivity is typically plotted as a function of operating time (Figure 13.19), referred
to as aflux decline curve. Flux decline is defined as the loss in system productivity, ex-
pressed as a percentage of initial productivity, that occurs with operating time, assuming
constant feedwater quality, pressure, temperature, and recovery. Flux decline causes an
increase in required feed pressure. The principal causes of flux decline are membrane
compaction and the effects of fouling and scaling that cannot be reversed by cleanings
(referred to as irreversible fouling or scaling). Additional design pumping pressure, typ-
ically at least a 15% to 20% increase in available net driving pressure, must be included
in the design to offset flux decline.
Membrane compaction occurs when the membrane compresses under the applied pres-
sure of operation. The degree of compaction depends on the specific membrane type. This
compression increases membrane resistance to water flow and increases NDP. A major-
ity of compaction (and flux loss) occurs during the first 100 h of operation. Membrane
projections allow for decreases in productivity over a period of time, usually 3 to 5 years.
~ ~ Marginal pretreatment and periodic cleaning
\
...., -..... ;-.
,
"x
%1 %% /%
Inadequate pretreatment / " %'~ " -- ..
and frequent cleaning
¢1
*Assumes constant feedwater quality, pressure, temperature, and recovery
Time
FIGURE 13.19 Membrane flux decline curves under different pretreatment conditions. (Adapted from
DuPont Permasep Products Engineering Manual, 1992.)