
Page 429 -
P. 429
13.26 CHAPTER THIRTEEN
The basic behavior of permselective (semipermeable) membranes
Design Equations.
can be described by the following two diffusion model equations. Permeate flow through
the membrane may be expressed as
Fw = A × (Ptm - "N'tm)
where Fw = water flux, g/(cm 2 • s)
A = water permeability coefficient, g/(cm 2 • s • atm)
Ptm = hydraulic pressure differential applied across membrane, atm
7rtm = osmotic pressure differential across membrane, atm
The solute (or salt) flux through the membrane may be expressed as
Fs = B X (C1 -- C2)
where Fs = solute (or salt) flux, g/(cm 2 • s)
B = solute (or salt) permeability constant, cm/s
Cl - C2 = concentration gradient across membrane, g/cm 3
Water and solute permeability coefficients are characteristic of the particular membrane
type.
Water flux depends on applied pressure, but solute flux does not. As pressure of mem-
brane feedwater increases, water flow through the membrane (water flux) increases, while
solute flow remains essentially unchanged. Permeate quantity increases with increased ap-
plied pressure, as does the quality (decreased solute concentration).
Water flux decreases as the salinity of the feed increases because of increased osmotic
pressure differential resulting from increased salinity. As increasing amounts of water pass
through the membrane system, the salinity of the remaining feedwater (concentrate) in-
creases. Concentrate osmotic pressure increases, resulting in a lower water flux with in-
creasing overall percent water recovery.
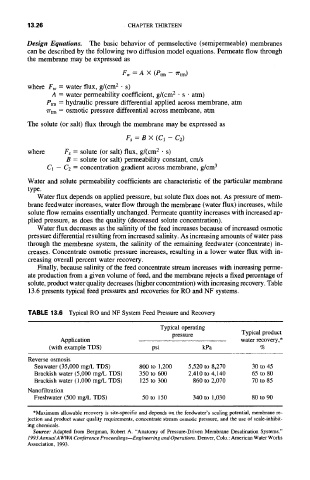
Finally, because salinity of the feed concentrate stream increases with increasing perme-
ate production from a given volume of feed, and the membrane rejects a fixed percentage of
solute, product water quality decreases (higher concentration) with increasing recovery. Table
13.6 presents typical feed pressures and recoveries for RO and NF systems.
TABLE 13.6 Typical RO and NF System Feed Pressure and Recovery
Typical operating
pressure Typical product
Application water recovery,*
(with example TDS) psi kPa %
Reverse osmosis
Seawater (35,000 mg/L TDS) 800 to 1,200 5,520 to 8,270 30 to 45
Brackish water (5,000 mg/L TDS) 350 to 600 2,410 to 4,140 65 to 80
Brackish water (1,000 mg/L TDS) 125 to 300 860 to 2,070 70 to 85
Nanofiltration
Freshwater (500 mg/L TDS) 50 to 150 340 to 1,030 80 to 90
*Maximum allowable recovery is site-specific and depends on the feedwater's scaling potential, membrane re-
jection and product water quality requirements, concentrate stream osmotic pressure, and the use of scale-inhibit-
ing chemicals.
Source: Adapted from Bergman, Robert A. "Anatomy of Pressure-Driven Membrane Desalination Systems."
1993 Annual A WWA Conference Proceedings--Engineering and Operations. Denver, Colo.: American Water Works
Association, 1993.