
Page 194 - 15 Dangerously Mad Projects for the Evil Genius
P. 194
Chapter 13 ■ Levitation Machine 171
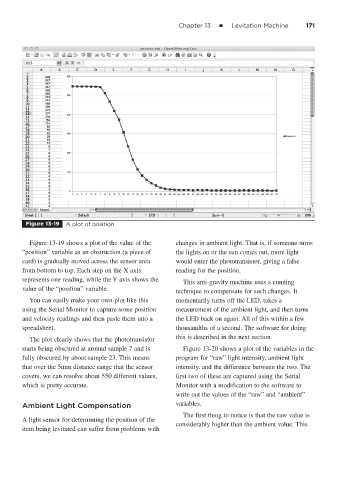
Figure 13-19 A plot of position
Figure 13-19 shows a plot of the value of the changes in ambient light. That is, if someone turns
“position” variable as an obstruction (a piece of the lights on or the sun comes out, more light
card) is gradually moved across the sensor area would enter the phototransistor, giving a false
from bottom to top. Each step on the X axis reading for the position.
represents one reading, while the Y axis shows the This anti-gravity machine uses a cunning
value of the “position” variable. technique to compensate for such changes. It
You can easily make your own plot like this momentarily turns off the LED, takes a
using the Serial Monitor to capture some position measurement of the ambient light, and then turns
and velocity readings and then paste them into a the LED back on again. All of this within a few
spreadsheet. thousandths of a second. The software for doing
The plot clearly shows that the phototransistor this is described in the next section.
starts being obscured at around sample 7 and is Figure 13-20 shows a plot of the variables in the
fully obscured by about sample 23. This means program for “raw” light intensity, ambient light
that over the 5mm distance range that the sensor intensity. and the difference between the two. The
covers, we can resolve about 550 different values, first two of these are captured using the Serial
which is pretty accurate. Monitor with a modification to the software to
write out the values of the “raw” and “ambient”
Ambient Light Compensation variables.
The first thing to notice is that the raw value is
A light sensor for determining the position of the
considerably higher than the ambient value. This
item being levitated can suffer from problems with