
Page 318 - A Comprehensive Guide to Solar Energy Systems
P. 318
Chapter 15 • Integration of PV Generated Electricity into National Grids 323
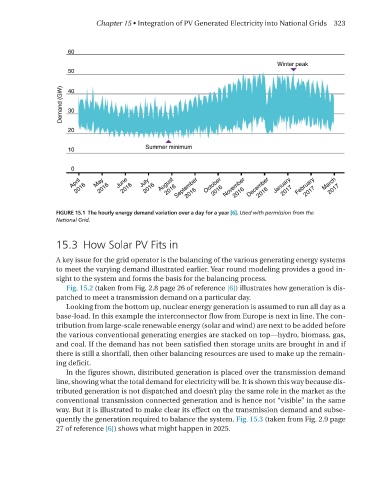
FIGURE 15.1 The hourly energy demand variation over a day for a year [6]. Used with permission from the
National Grid.
15.3 How Solar PV Fits in
A key issue for the grid operator is the balancing of the various generating energy systems
to meet the varying demand illustrated earlier. year round modeling provides a good in-
sight to the system and forms the basis for the balancing process.
Fig. 15.2 (taken from Fig. 2.8 page 26 of reference [6]) illustrates how generation is dis-
patched to meet a transmission demand on a particular day.
looking from the bottom up, nuclear energy generation is assumed to run all day as a
base-load. In this example the interconnector flow from Europe is next in line. The con-
tribution from large-scale renewable energy (solar and wind) are next to be added before
the various conventional generating energies are stacked on top—hydro, biomass, gas,
and coal. If the demand has not been satisfied then storage units are brought in and if
there is still a shortfall, then other balancing resources are used to make up the remain-
ing deficit.
In the figures shown, distributed generation is placed over the transmission demand
line, showing what the total demand for electricity will be. It is shown this way because dis-
tributed generation is not dispatched and doesn’t play the same role in the market as the
conventional transmission connected generation and is hence not “visible” in the same
way. But it is illustrated to make clear its effect on the transmission demand and subse-
quently the generation required to balance the system. Fig. 15.3 (taken from Fig. 2.9 page
27 of reference [6]) shows what might happen in 2025.