
Page 319 - A Comprehensive Guide to Solar Energy Systems
P. 319
324 A COMPrEhENSIVE GUIdE TO SOlAr ENErGy SySTEMS
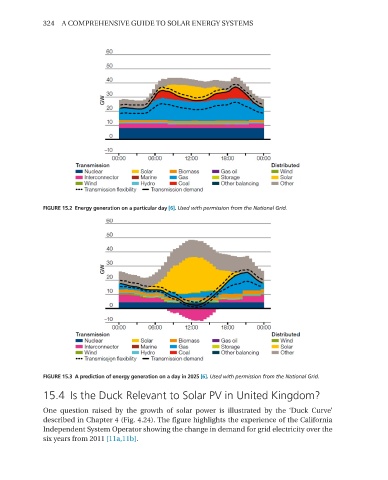
FIGURE 15.2 Energy generation on a particular day [6]. Used with permission from the National Grid.
FIGURE 15.3 A prediction of energy generation on a day in 2025 [6]. Used with permission from the National Grid.
15.4 Is the Duck Relevant to Solar PV in United Kingdom?
One question raised by the growth of solar power is illustrated by the ‘duck Curve’
described in Chapter 4 (Fig. 4.24). The figure highlights the experience of the California
Independent System Operator showing the change in demand for grid electricity over the
six years from 2011 [11a,11b].