
Page 24 - Hybrid Enhanced Oil Recovery Using Smart Waterflooding
P. 24
16 Hybrid Enhanced Oil Recovery using Smart Waterflooding
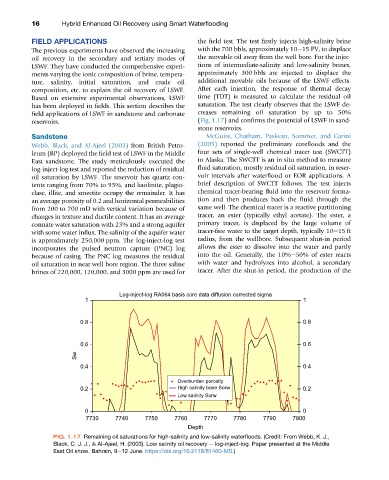
FIELD APPLICATIONS the field test. The test firstly injects high-salinity brine
The previous experiments have observed the increasing with the 700 bbls, approximately 10e15 PV, to displace
oil recovery in the secondary and tertiary modes of the movable oil away from the well bore. For the injec-
LSWF. They have conducted the comprehensive experi- tions of intermediate-salinity and low-salinity brines,
ments varying the ionic composition of brine, tempera- approximately 300 bbls are injected to displace the
ture, salinity, initial saturation, and crude oil additional movable oils because of the LSWF effects.
composition, etc. to explain the oil recovery of LSWF. After each injection, the response of thermal decay
Based on extensive experimental observations, LSWF time (TDT) is measured to calculate the residual oil
has been deployed in fields. This section describes the saturation. The test clearly observes that the LSWF de-
field applications of LSWF in sandstone and carbonate creases remaining oil saturation by up to 50%
reservoirs. (Fig. 1.17) and confirms the potential of LSWF in sand-
stone reservoirs.
Sandstone McGuire, Chatham, Paskvan, Sommer, and Carini
Webb, Black, and Al-Ajeel (2003) from British Petro- (2005) reported the preliminary corefloods and the
leum (BP) deployed the field test of LSWF in the Middle four sets of single-well chemical tracer test (SWCTT)
East sandstone. The study meticulously executed the in Alaska. The SWCTT is an in situ method to measure
log-inject-log test and reported the reduction of residual fluid saturation, mostly residual oil saturation, in reser-
oil saturation by LSWF. The reservoir has quartz con- voir intervals after waterflood or EOR applications. A
tents ranging from 70% to 95%, and kaolinite, plagio- brief description of SWCTT follows. The test injects
clase, illite, and smectite occupy the remainder. It has chemical tracer-bearing fluid into the reservoir forma-
an average porosity of 0.2 and horizontal permeabilities tion and then produces back the fluid through the
from 200 to 700 mD with vertical variation because of same well. The chemical tracer is a reactive partitioning
changes in texture and ductile content. It has an average tracer, an ester (typically ethyl acetate). The ester, a
connate water saturation with 23% and a strong aquifer primary tracer, is displaced by the large volume of
with some water influx. The salinity of the aquifer water tracer-free water to the target depth, typically 10e15 ft
is approximately 250,000 ppm. The log-inject-log test radius, from the wellbore. Subsequent shut-in period
incorporates the pulsed neutron capture (PNC) log allows the ester to dissolve into the water and partly
because of casing. The PNC log measures the residual into the oil. Generally, the 10%e50% of ester reacts
oil saturation in near well bore region. The three saline with water and hydrolyzes into alcohol, a secondary
brines of 220,000, 120,000, and 3000 ppm are used for tracer. After the shut-in period, the production of the
Log-inject-log RA064 basis core data diffusion corrected sigma
1 1
0.8 0.8
0.6 0.6
Sw
0.4 0.4
Overburden porosity
0.2 High salinity base Sorw 0.2
Low salinity Sorw
0 0
7730 7740 7750 7760 7770 7780 7790 7800
Depth
FIG. 1.17 Remaining oil saturations for high-salinity and low-salinity waterfloods. (Credit: From Webb, K. J.,
Black, C. J. J., & Al-Ajeel, H. (2003). Low salinity oil recovery e log-inject-log. Paper presented at the Middle
East Oil show, Bahrain, 9e12 June. https://doi.org/10.2118/81460-MS.)