
Page 10 - A Practical Companion to Reservoir Stimulation
P. 10
A. Reservoir and Well Considerations
EXAMPLE A-1
The same data can be interpreted through type-curve
Calculation of the Permeability and the matchbg. This is shown in Fig. A-3 where the data are
Skin Effect from an Oilwell Test
matched against the Bourdet et al. (1983) solution. The match
points extracted from Fig. A-3 are
An oil well was tested during a 96-hr drawdown. Measured
bottomhole pressures are listed in Table A- 1, aqd relevant = 1.02
well and reservoir data are shown in Table A-2. Calculate the Ap = 1Opsi
permeability and the skin effect. t,/c, = 0.22
t = 0.1 hr
Solution (Ref. Sections 1-2,l-2.1,l-2.5,l-2.7) and CDeZJ = lo8.
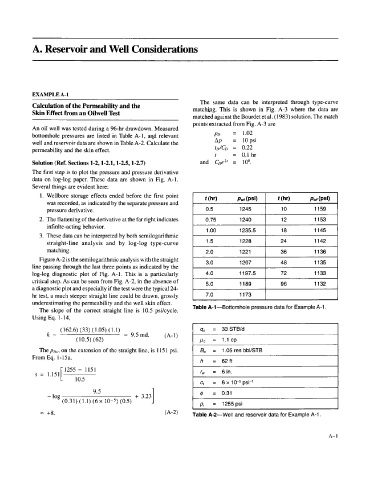
The first step is to plot the pressure and pressure derivative
data on log-log paper. These data are shown in Fig. A-1.
Several things are evident here:
1. Wellbore storage effects ended before the first point
was recorded, as indicated by the separate pressure and
pressure derivative. 0.5 1245 10 1159
2. The flattening of the derivative at the far right indicates 0.75 1240 12 1153
infinite-acting behavior. I 1.00 1235.5 I 18 1145 I
3. These data can be interpreted by both semilogarithmic I I 1142 I
straight-line analysis and by. log-log type-curve 1.5 1228 24
matching. I 2.0 1221 1 36 1136 I
Figure A-2 is the semilogarithmic analysis with the straight
line passing through the last three points as indicated by the 3.0 1207 48 1135
log-log diagnostic plot of Fig. A-1. This is a particularly 4.0 1 197.5 72 1133
critical step. As can be seen from Fig. A-2, in the absence of I 5.0 1189 I 96 1132 I
a diagnostic plot and especially if the test were the typical 24-
hr test, a much steeper straight line could be drawn, grossly I 7.0 1173 I I
underestimating the permeability and the well skin effect.
The slope of the correct straight line is 10.5 psikycle. Table A-1-Bottomhole pressure data for Example A-1.
Using Eq. 1 - 14,
(162.6) (33) (1.05) (1.1) qo = 33 STBld
k= = 9.5md. (A-1)
(10.5) (62) flo = 1.1 cp
The p/hr, on the extension of the straight line, is 1 15 1 psi. I So = 1.05 res bbl1STB I
From Eq. 1-15a, I
I h = 62ft
[ 10.5 = 6 x 10⁻⁵ psi-'
s = 1.151 1255 - 1151 I r, = 6 in. I
9.5 1 C,
4
- log + 3.23 = 0.31
(0.31) (1.1) (6x (0.5) P, = 1255 psi
= +8. ('4-2) Table A-2-Well and reservoir data for Example A-1
A- 1