Page 11 - A Practical Companion to Reservoir Stimulation
P. 11

PRACTICAL COMPANION TO RESERVOIR STIMULATION


            From Eq. 1-2 and the pressure match:                   From the value of the CDe"'(obtained from the match), the
                                                                 skin effect can be calculated:
                  (1.02) (141.2) (33) (1.1)  (1.05)
              k=                             =  8.3 md.   (A-3)
                           (66) (10)
                                                                                                            (A-6)
              Dividing both sides of Eq. 1-3 by C,  results in
                                                                   The two analyses are within  12% for the permeability and
                                 0.000264 k t
                        t,lC,   =                      (A-4)     17% for the skin effect, which is an excellent agreement.
                                 c, 4 P c, r:, .
            Eq. A-4 and the time match can be used to calculate CD:   ,

                        (0.000264) (8.3) (0.1)                       ' <
             CD =                                =  195. (A-5)
                  (0.22) (0.31) (1.1)  (6x   (0.5)*


                  1000


               h
               v)
               a
               - 100
              21%
              'D                                                         0
               *-                                                   0
               n
               C
               rn
               Q                                                0
               U                                                    0  0
                                                           0.                 0
                                                                                 0
                                                                                      0


                   10


                    5
                       -1                                                                                  1 00


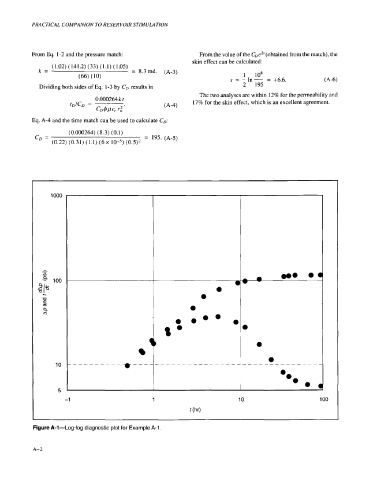
            Figure A-1-Log-log  diagnostic plot for Example A-1


            A-  2
   6   7   8   9   10   11   12   13   14   15   16