
Page 117 - A Practical Companion to Reservoir Stimulation
P. 117
PRACTICAL COMPANION TO RESERVOIR STIMULATION
EXAMPLE G-5
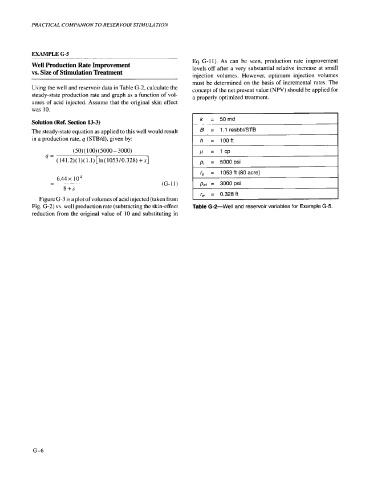
Eq. G- 11). As can be seen, production rate improvement
Well Production Rate Improvement levels off after a very substantial relative increase at small
vs. Size of Stimulation lkeatment
injection volumes. However, optimum injection volumes
must be determined on the basis of incremental rates. The
Using the well and reservoir data in Table (3-2, calculate the concept of the net present value (NPV) should be applied for
steady-state production rate and graph as a function of vol- a properly optimized treatment.
umes of acid injected. Assume that the original skin effect
was 10.
Solution (Ref. Section 13-3) I k = 50md I
The steady-state equation as applied to this well would result B F 1.1 resbbl/STB
in a production rate, q (STB/d), given by: h = 100ft
(50) ( 100) (5000 - 3000) /.I = 1cp
4=
(141.2)( 1)( l.l)[ln( 1053/0.328) +s] pi = 5000psi
I
I re = 1053 ft (80 acre)
((3-11) p~r = 3000psi
r, = 0.328 ft
Figure G-3 is a plot of volumes of acid injected (taken from
Fig. G-2) vs. well production rate (subtracting the skin-effect Table G-2-Well and reservoir variables for Example G-5.
reduction from the original value of 10 and substituting in
G-6