Page 118 - A Practical Companion to Reservoir Stimulation
P. 118

DESIGN OF MATRIX TREATMENTS


                   5000


              h
              9
              m
              I-
              ",
               0-
               6
               m
               I
              0:
               C
              .-
               0
               I
               0
               3
              -0   4000
               2
              a
              -
              -
              P


                   3000
                       0                       10,000                   20,000                   30,000

                                                        Acid Volume Injected (gal)


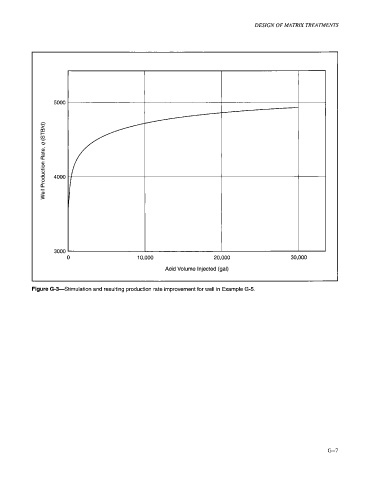
            Figure G-3-Stimulation  and resulting production rate improvement for well in Example G-5.


                                                                                                             G-7
   113   114   115   116   117   118   119   120   121   122   123