
Page 147 - A Practical Companion to Reservoir Stimulation
P. 147
STIMULATION OF HORIZONTAL WELLS
EXAMPLE 5-3
Horizontal Well Intlow Performance 9= 6.62 Ap for L = 500 ft, (J-9)
with Pressure-Sensitive Skin Effect 2.65 + 0.0138 Ap
A vertical well exhibited a very rapid increase in the calcu- 4= 6.62 Ap for L = 1000 ft, (J-10)
lated skin effect in two successive pressure buildup tests only 1.87 + 0.0138Ap
a month apart. While the calculated apparent permeability and
remained largely constant (as it should), the skineffect increased
from a near zero value to a very large +18. The drawdown 6.62 Ap forL = 1500ft. (J-11)
before the second test was 1300 psi. Further analysis has 9= 1.44 + 0.0138 Ap
shown that phase changes in the reservoir and the resulting Equations J-9 through J- 1 1 imply continuously increasing
relative-permeability-to-oil reduction could not account for q with Ap, although the slope of the curve will decrease at
the increase in the skin effect. large Ap. However, no optimum pressure drop can be ob-
A stimulated horizontal well (0 skin effect) could produce tained. (Taking the derivate of q with respect to Ap and setting
as much as 2500 STB/d from a 500-ft length, as can be readily it equal to 0 would show a point where a maximum or
calculated from Eq. 19-3. minimum q would be encountered. However, no such point of
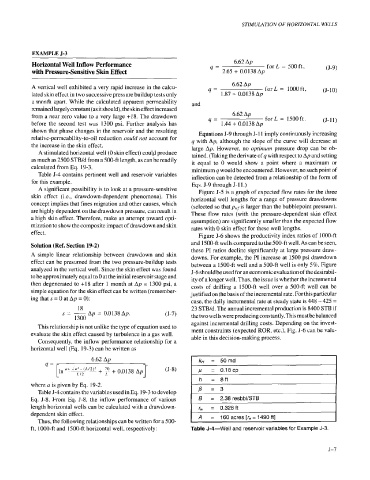
Table 5-4 contains pertinent well and reservoir variables inflection can be detected from a relationship of the form of
for this example. Eqs. J-9 through 5-11.)
A significant possibility is to look at a pressure-sensitive Figure J-5 is a graph of expected flow rates for the three
skin effect (i.e., drawdown-dependent phenomena). This horizontal well lengths for a range of pressure drawdowns
concept implies that fines migration and other causes, which (selected so that pHI is larger than the bubblepoint pressure).
are highly dependent on the drawdown pressure, can result in These flow rates (with the pressure-dependent skin effect
a high skin effect. Therefore, make an attempt toward opti- assumption) are significantly smaller than the expected flow
mization to show the composite impact of drawdown and skin rates with 0 skin effect for these well lengths.
effect. Figure 5-6 shows the productivity index ratios of 1000-ft
Solution (Ref. Section 19-2) and 1500-ft wells compared to the 500-ft well. As can be seen,
A simple linear relationship between drawdown and skin these PI ratios decline significantly at large pressure draw-
downs. For example, the PI increase at 1500 psi drawdown
effect can be presumed from the two pressure-buildup tests between a 1500-ft well and a 500-ft well is only 5%. Figure
analyzed in the vertical well. Since the skin effect was found J-6 should be used for an economic evaluation of the desirabil-
to be approximately equal to 0 at the initial reservoir stage and ity of a longer well. Thus, the issue is whether the incremental
then degenerated to + 18 after 1 month at Ap = 1300 psi, a costs of drilling a 1500-ft well over a 500-ft well can be
simple equation for the skin effect can be written (remember- justified on the basis of the incremental rate. For this particular
ing that s = 0 at Ap = 0):
case, the daily incremental rate at steady state is 448 - 425 =
18 23 STB/d. The annual incremental production is 8400 STB if
,y=- Ap = 0.0138 Ap. (5-7) the two wells were producing constantly. This must be balanced
1300
This relationship is not unlike the type of equation used to against incremental drilling costs. Depending on the invest-
evaluate the skin effect caused by turbulence in a gas well. ment constraints (expected ROR, etc.), Fig. 5-6 can be valu-
able in this decision-making process.
Consequently, the inflow performance relationship for a
horizontal well (Eq. 19-3) can be written as
Eq. 5-8. From Eq. 5-8, the inflow performance of various f i l I
= 0.18~~
I ,u
I
= 8R
h
where CI is given by Eq. 19-2.
Table 5-4 contains the variables used in Eq. 19-3 to develop
length horizontal wells can be calculated with a drawdown-
dependent skin effect. = 160 acres Ira = 1490 ftl
Thus, the following relationships can be written for a 500-
ft, 1 000-ft and 1500-ft horizontal well, respectively: Table J-4-Well and reservoir variables for Example J-3.
.-
J- I