Page 143 - A Practical Companion to Reservoir Stimulation
P. 143

I
               VI
                 L


                                       0


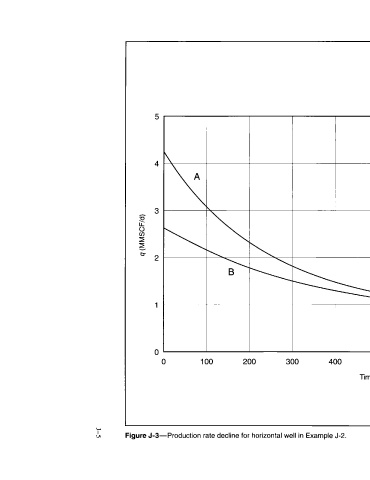
               Figure  J-3-Production


                                       100


                                                                     B
                                                                             \


                                       200


                                                                                \
                                                                       \


                                       300


                                                                        \
                                                                   \
               rate decline for horizontal well in Example
                                       400
               J-2.


                                       500

                                  Time (days)


                                       600


                                       700


                                       800


                                       900


                                       1000


                                                       STIMULATION OF HORIZONTAL WELLS
   138   139   140   141   142   143   144   145   146   147   148