
Page 30 - [B._MURPHY,_C._MURPHY,_B._HATHAWAY]_A_working_meth
P. 30
14 Chapter I
numbers for plotting purposes. Add additional columns to the
table if necessary.
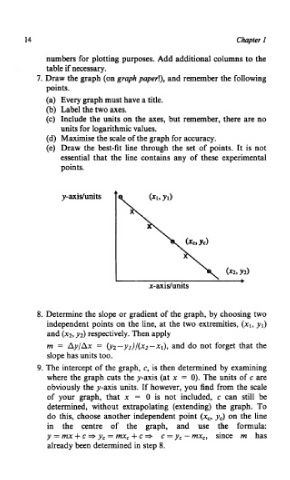
7. Draw the graph (on graph paper!), and remember the following
points.
(a) Every graph must have a title.
(b) Label the two axes.
(c) Include the units on the axes, but remember, there are no
units for logarithmic values.
(d) Maximise the scale of the graph for accuracy.
(e) Draw the best-fit line through the set of points. It is not
essential that the line contains any of these experimental
points.
y-axidunits
8. Determine the slope or gradient of the graph, by choosing two
independent points on the line, at the two extremities, (XI, yl)
and (x2, y2) respectively. Then apply
m = Ay/Ax = (y2-y1)/(x2-xI), and do not forget that the
slope has units too.
9. The intercept of the graph, c, is then determined by examining
where the graph cuts the y-axis (at x = 0). The units of c are
obviously the y-axis units. If however, you find from the scale
of your graph, that x = 0 is not included, c can still be
determined, without extrapolating (extending) the graph. To
do this, choose another independent point (xc, yc) on the line
in the centre of the graph, and use the formula:
y = mx + c + y, = mx, + c + c = y, - mx,, since m has
already been determined in step 8.