Page 149 - Accounting Information Systems
P. 149

120     PART I        Overview of Accounting Information Systems

                         THE PERPETRATORS OF FRAUDS
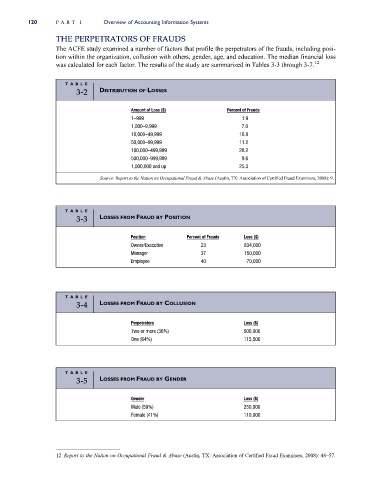
                         The ACFE study examined a number of factors that profile the perpetrators of the frauds, including posi-
                         tion within the organization, collusion with others, gender, age, and education. The median financial loss
                         was calculated for each factor. The results of the study are summarized in Tables 3-3 through 3-7. 12


                            TAB L E
                               3-2    DISTRIBUTION OF LOSSES


                                                Amount of Loss ($)          Percent of Frauds
                                                1–999                            1.9
                                                1,000–9,999                      7.0
                                                10,000–49,999                   16.8
                                                50,000–99,999                   11.2
                                                100,000–499,999                 28.2
                                                500,000–999,999                  9.6
                                                1,000,000 and up                25.3

                                      Source: Report to the Nation on Occupational Fraud & Abuse (Austin, TX: Association of Certified Fraud Examiners, 2008): 9.


                            TAB L E
                               3-3    LOSSES FROM FRAUD BY POSITION

                                               Position         Percent of Frauds  Loss ($)
                                               Owner/Executive       23           834,000
                                               Manager               37           150,000
                                               Employee              40           70,000


                            TAB L E
                               3-4    LOSSES FROM FRAUD BY COLLUSION


                                                Perpetrators                     Loss ($)
                                                Two or more (36%)                500,000
                                                One (64%)                        115,500


                            TAB L E
                               3-5    LOSSES FROM FRAUD BY GENDER


                                                Gender                           Loss ($)
                                                Male (59%)                       250,000
                                                Female (41%)                     110,000


                         12 Report to the Nation on Occupational Fraud & Abuse (Austin, TX: Association of Certified Fraud Examiners, 2008): 48–57.
   144   145   146   147   148   149   150   151   152   153   154