
Page 150 - Accounting Information Systems
P. 150
CHAPTE R 3 Ethics, Fraud, and Internal Control 121
TAB L E
3-6 LOSSES FROM FRAUD BY AGE
Age Range Loss ($)
<26 25,000
26–30 50,000
31–35 113,000
36–40 145,000
41–50 250,000
51–60 500,000
>60 435,000
TAB L E
3-7 LOSSES FROM FRAUD BY EDUCATIONAL LEVEL
Education Level Loss ($)
High School 100,000
College 210,000
Postgraduate 550,000
Fraud Losses by Position within the Organization
Table 3-3 shows that 40 percent of the reported fraud cases were committed by nonmanagerial employ-
ees, 37 percent by managers, and 23 percent by executives or owners. Although the reported number of
frauds perpetrated by employees is higher than that of managers and almost twice that of executives, the
average losses per category are inversely related.
Fraud Losses and the Collusion Effect
Collusion among employees in the commission of a fraud is difficult to both prevent and detect. This is
particularly true when the collusion is between managers and their subordinate employees. Management
plays a key role in the internal control structure of an organization. They are relied upon to prevent and
detect fraud among their subordinates. When they participate in fraud with the employees over whom
they are supposed to provide oversight, the organization’s control structure is weakened, or completely
circumvented, and the company becomes more vulnerable to losses.
Table 3-4 compares the median losses from frauds committed by individuals acting alone (regardless
of position) and frauds involving collusion. This includes both internal collusion and schemes in which
an employee or manager colludes with an outsider such as a vendor or a customer. Although frauds
involving collusion are less common (36 percent of cases), the median loss is $500,000 as compared to
$115,500 for frauds perpetrated by individuals working alone.
Fraud Losses by Gender
Table 3-5 shows that the median fraud loss per case caused by males ($250,000) was more than twice that
caused by females ($110,000).
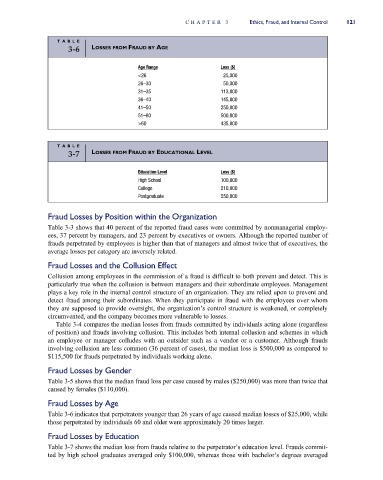
Fraud Losses by Age
Table 3-6 indicates that perpetrators younger than 26 years of age caused median losses of $25,000, while
those perpetrated by individuals 60 and older were approximately 20 times larger.
Fraud Losses by Education
Table 3-7 shows the median loss from frauds relative to the perpetrator’s education level. Frauds commit-
ted by high school graduates averaged only $100,000, whereas those with bachelor’s degrees averaged