
Page 153 - Acquisition and Processing of Marine Seismic Data
P. 153
144 2. MARINE SEISMIC DATA ACQUISITION
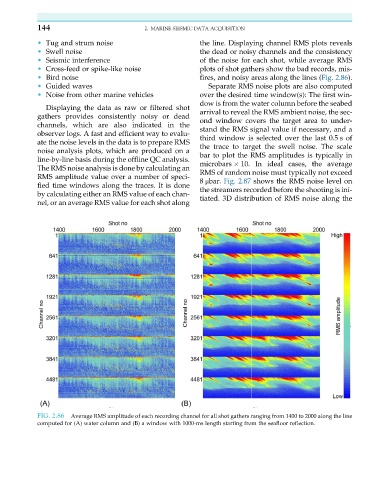
• Tug and strum noise the line. Displaying channel RMS plots reveals
• Swell noise the dead or noisy channels and the consistency
• Seismic interference of the noise for each shot, while average RMS
• Cross-feed or spike-like noise plots of shot gathers show the bad records, mis-
• Bird noise fires, and noisy areas along the lines (Fig. 2.86).
• Guided waves Separate RMS noise plots are also computed
• Noise from other marine vehicles over the desired time window(s): The first win-
dow is from the water column before the seabed
Displaying the data as raw or filtered shot
arrival to reveal the RMS ambient noise, the sec-
gathers provides consistently noisy or dead
ond window covers the target area to under-
channels, which are also indicated in the
stand the RMS signal value if necessary, and a
observer logs. A fast and efficient way to evalu-
third window is selected over the last 0.5 s of
ate the noise levels in the data is to prepare RMS
the trace to target the swell noise. The scale
noise analysis plots, which are produced on a
bar to plot the RMS amplitudes is typically in
line-by-line basis during the offline QC analysis.
microbars 10. In ideal cases, the average
The RMS noise analysis is done by calculating an
RMS of random noise must typically not exceed
RMS amplitude value over a number of speci-
8 μbar. Fig. 2.87 shows the RMS noise level on
fied time windows along the traces. It is done
the streamers recorded before the shooting is ini-
by calculating either an RMS value of each chan-
tiated. 3D distribution of RMS noise along the
nel, or an average RMS value for each shot along
FIG. 2.86 Average RMS amplitude of each recording channel for all shot gathers ranging from 1400 to 2000 along the line
computed for (A) water column and (B) a window with 1000-ms length starting from the seafloor reflection.