
Page 157 - Acquisition and Processing of Marine Seismic Data
P. 157
148 2. MARINE SEISMIC DATA ACQUISITION
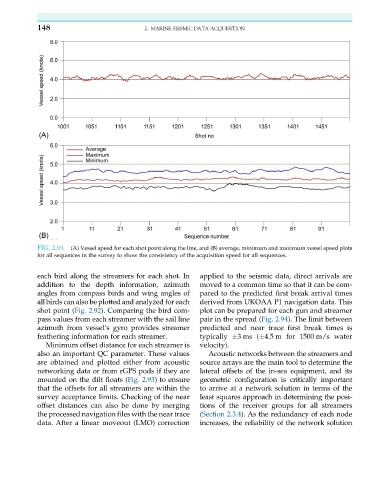
FIG. 2.91 (A) Vessel speed for each shot point along the line, and (B) average, minimum and maximum vessel speed plots
for all sequences in the survey to show the consistency of the acquisition speed for all sequences.
each bird along the streamers for each shot. In applied to the seismic data, direct arrivals are
addition to the depth information, azimuth moved to a common time so that it can be com-
angles from compass birds and wing angles of pared to the predicted first break arrival times
all birds can also be plotted and analyzed for each derived from UKOAA P1 navigation data. This
shot point (Fig. 2.92). Comparing the bird com- plot can be prepared for each gun and streamer
pass values from each streamer with the sail line pair in the spread (Fig. 2.94). The limit between
azimuth from vessel’s gyro provides streamer predicted and near trace first break times is
feathering information for each streamer. typically 3ms ( 4.5 m for 1500 m/s water
Minimum offset distance for each streamer is velocity).
also an important QC parameter. These values Acoustic networks between the streamers and
are obtained and plotted either from acoustic source arrays are the main tool to determine the
networking data or from rGPS pods if they are lateral offsets of the in-sea equipment, and its
mounted on the dilt floats (Fig. 2.93) to ensure geometric configuration is critically important
that the offsets for all streamers are within the to arrive at a network solution in terms of the
survey acceptance limits. Checking of the near least squares approach in determining the posi-
offset distances can also be done by merging tions of the receiver groups for all streamers
the processed navigation files with the near trace (Section 2.3.4). As the redundancy of each node
data. After a linear moveout (LMO) correction increases, the reliability of the network solution